MARKET FLASH:

"It seems the donkey is laughing, but he instead is braying (l'asino sembra ridere ma in realtà raglia)": si veda sotto "1927-1933: Pompous Prognosticators" per avere la conferma che la storia non si ripete ma fà la rima.


sabato 19 ottobre 2019

Without the Outliers, Inflation Is Running Hot. Fed Has Started Mentioning these Measures in the Minutes


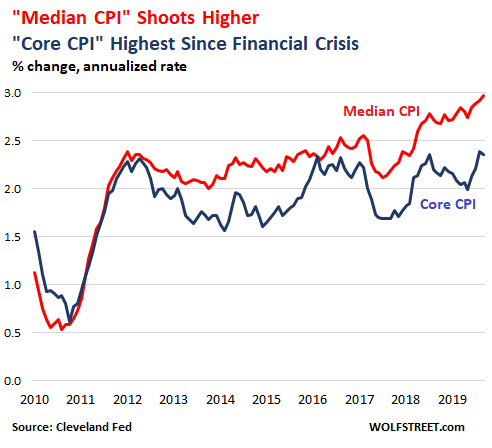
Cleveland Fed's Underlying Inflation Measure Hits 3.0%, Hottest in the Data.

"Soft inflation?" The inflation measure by the Cleveland Fed — the "Median CPI," which is based on Consumer Price Index data but removes the outliers in the data to reveal underlying inflation trends — jumped 3.0% for September, the highest in the data series going back to the Financial Crisis, when this measure was launched.

By comparison, "core CPI," which removes food and energy prices, hit 2.4% in August and September, the highest since September 2008:

The Fed is mentioning these kinds of alternative inflation measures in the minutes of the FOMC meetings – voiced by "some participants" – to show that underlying trends in inflation are pointing upward, except for a few outliers, such as the re-collapse of oil prices and a few other items that skew the overall results, and to show that the "soft inflation readings during the earlier period were transitory."

The oil bust that started in mid-2014 did a job on overall inflation data. The price of oil plunged by over 70%. Crude oil is not only refined into transportation and heating fuels; it's also used as feedstock for the chemical industry. And that worked itself into the broader pricing data. In October last year, oil prices had recovered partially, with WTI trading in the range of $75 a barrel. But then oil prices collapsed again, and are now down 28% from a year ago.

Oil does this from time to time, as do agricultural commodities, and that is why inflation measures are offered in at least two versions: "All items" and "without food and energy." The all-items CPI in September rose a tame 1.7% from a year ago. But the CPI without food and energy("core CPI," the blue line in the chart above) jumped 2.4% — the fastest rate since September 2008.

Energy and agricultural commodities are not the only items that skew overall inflation readings. There are other items as well that – for reasons unrelated to inflation – more or less briefly spike or collapse, before reverting toward the mean. The moves are related to short-term market manias, supply crunches, supply gluts, sudden price wars, and other factors that are unrelated to the purchasing power of the dollar (which is what consumer price inflation measures).

After the turmoil of the Financial Crisis, the Cleveland Fed launched the "Median CPI" in the chart above to show underlying trends of inflation in consumer prices and to predict inflation trends over the medium time horizon.

The Median CPI tracks the mid-point (median) of the 45 CPI components, with a cumulative importance of near 50%:

  • Above it are the components with the biggest price declines and the lowest price gains that combined weigh about 50% in the index.
  • Below it are the components with the biggest price gains, weighing the remaining 50%.

The line in between marks the midpoint of CPI, hence the "Median CPI." This line in the middle came in at 3.0% annualized rate in September.

The table (via the Cleveland Fed) shows the 45 CPI components for September 2019, from the components with the largest price declines (at the top, motor fuel: -25.1%) to the components with the largest price gains (at the bottom, lodging away from home: +28.1%). The mid-point (the point closest to a cumulative weight of 50) is the "median CPI," and is marked in bold (if your smartphone clips one of the four columns, hold it in landscape position):

Component1-Month Annualized % ChangeRelative Importance % Cumulative Relative Importance %
Motor Fuel-25.13.63.6
Women's and Girls' Apparel-18.71.24.8
Used Cars and Trucks-17.92.37.1
Fresh Fruits and Vegetables-15.01.08.1
Infants' and Toddlers' Apparel-13.40.18.3
Fuel Oil and Other Fuels-12.60.28.4
Miscellaneous Personal Goods-12.10.28.6
Watches and Jewelry-11.90.28.9
Medical Care Commodities-6.91.710.6
Personal Care Products-3.20.711.2
Alcoholic Beverages-3.11.012.2
Communication-1.53.515.7
Energy Services-1.53.319.0
New Vehicles-1.53.722.7
Footwear-1.20.723.4
Tenants' and Household Insurance0.10.423.8
Recreation0.45.729.4
Education0.73.132.5
Personal Care Services1.20.633.1
Nonalcoholic Beverages and Beverage Matls1.30.934.0
Processed Fruits and Vegetables1.40.334.3
Dairy and Related Products1.90.735.0
Motor Vehicle Maintenance and Repair2.31.136.1
Public Transportation2.51.137.3
South: Owners' Equivalent Rent of Residences2.58.245.4
Water/Sewer/Trash Collection Services2.71.146.5
Misc Personal Services3.01.047.5
Midwest: Owners' Equivalent Rent of Residences3.04.351.9
Food Away From Home3.26.158.0
Meats, Poultry, Fish and Eggs3.31.659.6
Motor Vehicle Insurance3.32.461.9
Northeast: Owners' Equivalent Rent of Residences3.45.167.1
Household Furnishings and Operation3.54.371.3
Other Food At Home3.71.873.2
West: Owners' Equivalent Rent of Residences3.96.779.9
Rent of Primary Residence4.38.187.9
Leased Cars and Trucks4.40.688.6
Medical Care Services4.57.195.7
Cereals and Bakery Products5.71.096.6
Car and Truck Rental6.90.196.8
Tobacco and Smoking Products7.50.797.4
Motor Vehicle Fees7.60.598.0
Motor Vehicle Parts and Equipment8.00.498.4
Men's and Boys' Apparel25.50.799.1
Lodging Away From Home28.10.9100.0

As you can see, some prices surge and other prices plunge, and many prices move up and down in smaller increments. Part of those moves are due to temporary factors. CPI is a weighted average of these moves and is skewed by outliers. Over the long term, the moves by these outliers wash out as they revert, but over the median term, they distort CPI.

That's the reason why CPI is so volatile though the actual loss of the purchasing power of the dollar over time is on a fairly steady trend.

The Cleveland Fed attempts to show the loss of the purchasing power of the dollar over the medium term, not influenced by the outliers. And based on this measure, the inflation trend is heating up. And "some participants" at the FOMC have started to point this out.

America's Road Map To $40 Trillion National Debt By 2028


Watch out!  At this very moment,professional economists of all stripes are making plans on your behalf. They're dreaming and scheming new and innovative ways to spend your money long before you've earned it.

While you're busy at the gristmill, grinding away for clients and customers, claims are being laid upon your life.  Your future earnings are being directed to boondoggles galore.  Yet these claims are in addition to everything Washington's already signed you up for.

At last count of the U.S. National Debt, every American citizen's on the hook for nearly $70,000.  Add U.S. Unfunded Liabilities – which includes Social Security, Medicare Parts A, B, and D, federal debt held by the public, plus federal employee and veteran benefits – and each citizen owes almost $383,000.  And this sum's going to double in the years ahead faster than you can say lickety-split.

These professional economists, enamored by the genius of their graphs, see tomorrow's recessions and know just how to prevent them.  Their master plan for reversing a recession before it strikes amounts to pre-emptive stimulus.  What's more, in concert with Washington's professional politicians, they're laboring day and night to roll out their bold plans before it's too late.

  • Fiscal space [don't know how much there is, but there's clearly more].  

  • Magic money [a bunch of light bulbs that went off in a bunch of politicians' heads].  

  • Unmet social needs [opportunities to spend].  

  • A generous spending package [$1.7 trillion].  

  • An excuse for fiscal action [fighting climate change].  

  • Automatic programs [sending checks to households as soon as a recession starts].

As you can see, the pros are on it...

'Don't Fret About Debt'

These – and many other – pre-emptive stimulus plans were outlined in a recent Reuters article.  The article, if you happened to miss it, was titled: In planning for next U.S. recession, economists say, don't fret about debt.

What to make of it?

Here at the Economic Prism we relish bumper sticker wisdom like we relish political campaign slogans.  A colorful mix of mindless absurdity appears when something's distilled down to several words or less.  Plus, when the expression rhymes…it's just the cat's meow.

Without question, 'don't fret about debt' is a fine – and poetic – example of everything that's wrong with everything.  As far as we can tell, no one has fretted about the debt for at least a generation or two.  In fact, the 21st century has been one big fat debt binge.

The reality is the growth of federal debt has been out of control for decades. The solution that's always repeated for reeling this back is that, somehow, the economy will grow its way out of it.  This has yet to transpire despite a variety of policies over the years that have generally involved borrowing money from the future and spending it today.

The simple fact is you can't grow your way out of debt when the debt's increasing faster than gross domestic product (GDP).  For example, in 2000 the federal debt was about $5.6 trillion and real U.S. GDP was about $12.5 trillion.  Today the federal debt is over $22.8 trillion and real U.S. GDP is about $19.02 trillion.

In just 19 years the federal debt has increased by over 307 percent while real U.S. GDP has increased just 52 percent.  This, by all practical means, is the opposite of an economy that's growing its way out of debt.  Moreover, these diverging trajectories are the opposite of what happens when people fret about debt.

America's Road Map to $40 Trillion National Debt by 2028

When people fret about debt, they tighten their belts, spend less than they make, and pay down what they owe.  Instead, public and private debt has rapidly outpaced economic growth.  And now, with professional economists and professional politicians tripping over themselves to borrow money and spend it, things are about to really get ugly.

The professional economists that were quoted in the article, the ones that say 'don't fret about debt,' include: Karen Dynan (former Fed and Treasury official now at the Peterson Institute for International Economics), Julia Coronado (former Fed staffer and founder of Macropolicy Perspectives Consultants), Catherine Mann (global chief economist at Citi), and Laurence Meyer (former Fed governor).

Certainly, these – and many other professional economists – are the same pickle heads that got us into this mess to begin with.  A twisted place where pre-emptive stimulus is the standard operating procedure (SOP) for scientific management of the economy.  No doubt, the professional politicians love it.  Pre-emptive stimulus and other popular delusions, like MMT, give them carte blanche power to rack up debt on an enormous scale.

Alas, with the pros in charge, America's en route to $40 trillion national debt by 2028.  The road map to get there from here has little to no resistance…

The federal budget deficit for fiscal year 2019 was nearly a trillion dollars.  Project that out over eight years and the national debt has jumped to $30 trillion.  But, remember, the economy was growing in 2019.

At some point over the next eight years, the economy will fall backwards.  The deficit will quickly jump to $2 trillion.  Then the professionals will spring to action…

They'll push through a $1.7 trillion spending package – on top of a $2 trillion deficit.  They'll take the fight to the scourge of climate change.  They'll send out automatic checks.  They'll redistribute wealth.  They'll fabricate nonsense jobs for everyone.  They'll take a massive whack at abolishing poverty.  They'll marshal all forces and laser focus them on the task of delivering the new earth.

By 2028 – or earlier – America will have a $40 trillion national with little of value to show for it.  Consumer prices will be sky-high.  The citizenry will be forever upside down.  And the schemers in Washington will hatch even greater plans to save us from the mess of their making.

This, of course, assumes catastrophe doesn't strike first.

Jamie Dimon Warns "Of Course There Is A Recession Ahead"

After Tuesday morning's barrage of bank earnings, which sent JPM shares higher as the bank reported record quarterly revenue, the CEO said during a conference call with reporters. Dimon said that geopolitical tensions (i.e. the US-China trade war) have not only discouraged economists, but American consumers and businesses, too.

"It does look like geopolitics, particularly around China and trade, are reducing business confidence and business capital expenditure," Dimon said during the call.

During trade negotiations late last week in Washington, the Chinese delegation reportedly offered to drop restrictions prohibiting foreign financial firms from owning a controlling stake in mainland financial-services companies. However, BBG reported Tuesday morning that Beijing wants Washington to drop all trade-war tariffs (Beijing had promised to spend $50 billion a year on US agricultural products) before it moves forward with any of it. JPM has agreed to buy a controlling stake in China International Fund Management (CIFM), a Chinese asset management firm.

Jamie Dimon

Circling back to the call with reporters following Tuesday's earnings report, Dimon said that while he expects a recession to arrive at some point during the not-too-distant future, the exact timing remains a mystery.

Almost exactly one month ago, the legendary bank CEO said his gut told him that a recession is "not imminent."

"Of course there's a recession ahead, but whether it's soon, we don't know," Dimon said. "Housing and wages look strong. It looks like we're still growing, but we'll see..."

For what it's worth, the NY Fed's proprietary gauge is presently indicating a 40% chance of a recession breaking out during the upcoming 12 months.

The 'Phase 1' deal between China and the US has yet to be written, even as President Trump and Vice Premier Liu He insisted on Friday that it had been finalized as a 'handshake' agreement.

Repo Market Liquidity Unexpectedly Deteriorates As Funding Shortage Surges 35% - 11/10/2019


While the market has by now fully priced in that the Fed will resume "NOT A QE", i.e. POMOs, i.e., BS-expanding Treasury Purchases as soon as the October FOMC (but more likely November), with Bank of America writing today that the Fed needs a "bazooka of asset purchases," estimating that the central bank needs to add about $300BN of reserves to return to an "abundant' level", and Goldman predicting that the Fed will unleash no less than $60BN in POMO for the first 4 month of "NOT A QE"...

... as it seeks to rapidly blow out its balance sheet to avoid any more repo tremors of the kind observed in September that sent the overnight G/C repo rate to 9.25%, there was a modest hiccup in this best laid plan this morning, when the New York Fed unexpectedly announced that use of its overnight repo facility surged by 35% in one day, with $61.55BN in securities submitted ($58.35BN in TSYs, $3.2BN in MBS) to today's op, up sharply from yesterday's $45.5BN

While it could have been worse - the $75BN facility was not oversubscribed - it could have been better, as Wall Street indicated that the funding/reserve shortage spiked to the highest level since Sept 30, when $63.5BN in securities were submitted to the O/N repo facility.

Separately, the Fed also announced that in today's 6-day Term Repo, $21.15BN in securities were submitted, or half the uptake in yesterday's 14-day repo.

What to make of this? Well, with Wall Street now more than aware that the Fed will do everything it needs to to address the ongoing funding squeeze in the repo market, which in itself should be sufficient to ease the stress in overnight funding, this has so far failed to materialize. Worse, investors are becoming increasingly concerned that even with "NOT A QE", year end could see even more dramatic repo market fireworks than those observed on December 31, 2018. In such a case, with the Fed literally throwing the "NOT A QE" kitchen sink at the problem, and the problem failing to go away, just how will Powell preserve the illusion that he knows what is causing the broken plumbing in the repo market if the Fed can's unclog it even when using its "bazooka." We will find out soon enough.