MARKET FLASH:

"It seems the donkey is laughing, but he instead is braying (l'asino sembra ridere ma in realtà raglia)": si veda sotto "1927-1933: Pompous Prognosticators" per avere la conferma che la storia non si ripete ma fà la rima.


venerdì 16 febbraio 2018

“Financial Stress” Spikes. Markets, Long in Denial, Suddenly Grapple with New Era

Fed's monetary policy shift is finally taking hold. It just took a while.

The weekly St. Louis Fed Financial Stress index, released today,
just spiked beautifully. It had been at historic lows back in November,
an expression of ultra-loose financial conditions in the US economy,
dominated by risk-blind investors chasing any kind of yield with a passion,
which resulted in minuscule risk premiums for investors and ultra-low
borrowing costs even for even junk-rated borrows. The index ticked
since then, but in the latest week, ended February 9, something 
happened:


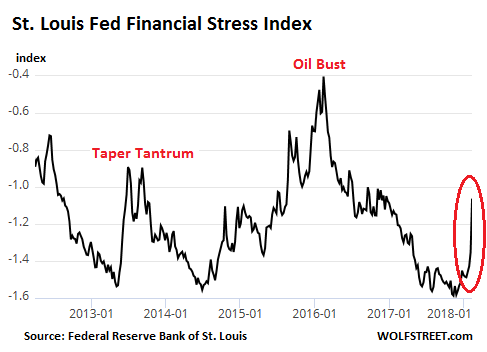
The index, which is made up of 18 components (seven interest
rate measures, six yield spreads, and five other indices) had 
hit a historic low of -1.6 on November 3, 2017, even as the
Fed had been raising its target range for the federal funds
rate and had started the QE Unwind. It began ticking up late last
year, hit -1.35 a week ago, and now spiked to -1.06.

The chart above shows the spike of the latest week in relationship
to the two-year Oil Bust that saw credit freeze up for junk-rated
energy companies, with the average yield of CCC-or-below-rated 
junk bonds soaring to over 20%. Given the size of oil-and-gas 
sector debt, energy credits had a large impact on the overall average.

The chart also compares today's spike to the "Taper Tantrum" in the
bond market in 2014 after the Fed suggested that it might actually
taper "QE Infinity," as it had come to be called, out of existence.
This caused yields and risk premiums to spike, as shown by the 
Financial Stress index.

This time, it's the other way around: The Fed has been raising rates
like clockwork, and its QE Unwind is accelerating, but for months markets 
blithely ignored it. Until suddenly they didn't.

This reaction is visible in the 10-year Treasury yield, which had been
declining for much of last year, despite the Fed's rate hikes, only to
surge late in the year and so far this year.

It's also visible in the stock market, which suddenly experienced a
dramatic bout of volatility and a breathless drop from record highs.
And it is now visible in other measures, including junk-bond yields
that suddenly began surging from historic low levels.

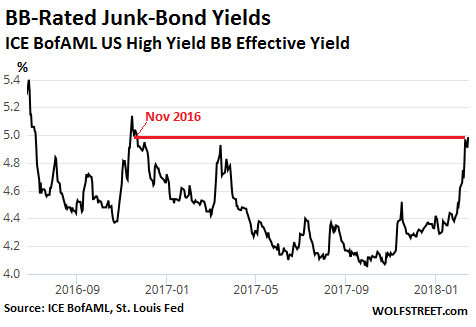
The chart of the ICE BofAML US High Yield BB Effective Yield Index,
via the St. Louis Fed, shows how the average yield of BB-rated
junk bonds surged from around 4.05% last September to 4.98%
now, the highest since November 20, 2016:


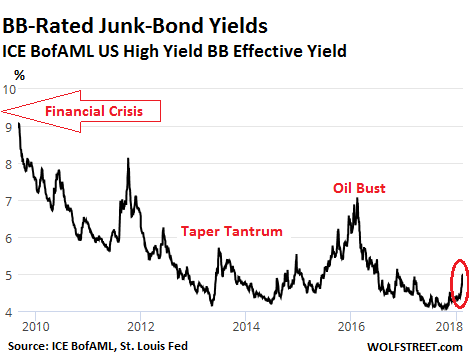
But a longer-term chart shows just how low the BB-yield still
is compared to where it had been in the years after the
Financial Crisis, and how much more of a trajectory it might 
have ahead:


When yields rise, it means that bond prices are dropping. And 
so the selloff that has been hitting the Treasury market is finally
creeping into the riskier parts of the corporate bond market,
which had been in denial of the Fed's efforts to tighten financial 
conditions via rate hikes and the QE Unwind.

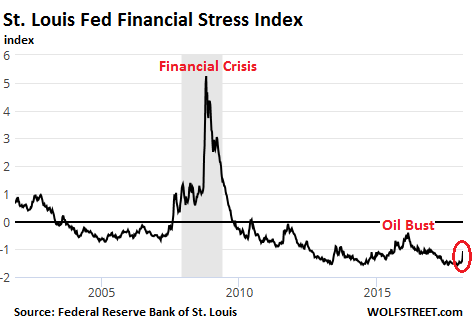
The Financial Stress Index is designed to show a level of zero
for "normal" financial conditions. When these conditions are easy
and when there is less financial stress than normal, the index is
negative. The index turns positive when financial conditions are
tighter than normal.

But at -1.06, it remains below zero. In other words,
financial conditions remain extraordinarily easy. This is clear
in a long-term chart of the index that barely shows the recent spike,
given the magnitude of prior moves:


This is precisely what the Fed wants to accomplish. The market is
just slow in reacting to a shift in monetary policies. But when
it begins to react, the adjustment can be sudden and large. Given
that the Fed wants to "normalize" financial conditions – where
these kinds of measures return to normal levels – there will have
to be quite a bit more tightening in the markets before the market 
catches up with the Fed's intentions. And the Fed itself is likely 
behind the curve – in which case it too will have to do some
catching up. So these adjustments in yields and prices are coming.
And yesterday's reports didn't help at all.

"Setting The Stage For A Broad Meltdown": Bond Funds See 5th Biggest Outflow On Record


Earlier this week, GMO's James Montier repeated verbatim  one of our recurring puzzling observations about the current market: while "a recent Bank of America ML survey showed the highest level of those citing "excessive valuation" ever. Yet despite this, the same survey showed fund managers to still be overweight in equities."  Back in August, we called this just one of the many bizarre market paradoxes observed in the market.
Here is another paradox.
As noted earlier, after last week's volocaust, this week was the best week for global stocks since 2011 as traders and algos furiously BTFD (and sold vol), clearly forgetting what happens when markets become too stretched, as they are becoming again.
It wasn't just stocks: junk bond yields dropped the most in three months, and CCC yields saw the biggest drop in more than five weeks yesterday amid what is reportedly buying flurry. As Bloomberg put it, "it was as if high yield investors were making up for the lost week" with HYCDX rising the most in 11 months, and junk bond ETFs, JNK and HYG, saw the biggest increase in three months.
As one would expected, junk spreads tightened across ratings.
And yet, despite surging prices, investors couldn't wait to get the hell out of credit amid the sudden repricing of inflation expectations which are certain to send yields higher (unless, of course, another wave of deflation emerges). In fact, BofA finds that last week saw the first simultaneous outflows from IG, HY and EM bond funds since the U.S. election.
According to BofA, which cited EPFR data, a whopping $14.1 billion was pulled from debt funds, with $10.9 billion taken from high-yield bonds alone, the second highest outflow on record.
Investment-grade bond funds also weren't spared, with $2 billion of redemptions ending a 59-week streak of inflows, BofA reported.
The iShares LQD Investment Grade Corporate Bond ETF posted a record one-day outflow Wednesday, the most among U.S.-listed passive vehicles across asset classes.
Separately, a report from Lipper confirmed the bond exodus, as investors pulled $6.3 billion from high yield bond funds for week ended Feb 14, the second biggest weekly outflow on record, and the fifth straight week of outflows, with the total over that period rising to $15 billion according to BloombergThe biggest outflow on record was $7.06b in August 2014.
Derivatives tied to corporate bonds moved more than the underlying cash debt last week - another sign that investors sold more liquid holdings during the equity turmoil rather than offload harder-to-sell debt, according to JPMorgan Chase & Co.
Which begs the question: if everyone is selling, how are yields lower and spreads tighter; i.e.who is buying?
"Investors don't sell their cash bonds in a big way until they are forced to, which happens when the outflows start picking up more sustainably," Morgan Stanley wrote this week.
Here are more details on fund flows:
First IG bond fund redemptions in 60 weeks ($2.0bn)
HY bond redemptions second highest on record ($10.9bn)
Largest EM debt outflows for 64 weeks ($2.9bn)

Modest muni fund outflows ($0.7bn)

Strong govt/Tsy fund inflows continue ($2.4bn)

Tiny TIPS inflows ($0.01bn)

Small bank loan fund outflows ($0.2bn)

Meanwhile, there was a similar paradox in stocks, where equities recovered from last week's record $30.6 bn in weekly outflows with $5.9bn in global inflows in the latest week, although US equity redemptions continued and saw $7.2 billion in money pulled after last week's record outflows.
The problem is that while equity vol tends to fade fast, a similar move in bonds or rates, could have far more troubling consequences: "The narrative is really becoming more about inflation and rate risk creeping into the broad markets," said Henry Peabody, a money manager at Eaton Vance Corp., with more than $400 billion of assets. "It's hard to think of elevated volatility in both rates and equity not eventually seeping into credit."
As Bloomberg writes:
These indicators may signal the tide is shifting. As recently as last week, corporate obligations outperformed -- anchored by long-term investors that stayed put while gauges of stock and rates volatility surged. Risk premiums on corporate bonds widened by a modest 10 basis points even as global stock indexes flashed bear-market signals.
As Morgan Stanley adds, "creeping corporate leverage is setting the stage for a broader market meltdown while higher real rates drive down asset values." Needless to say, Morgan Stanley projects negative returns for corporate bonds in the U.S., Europe and Asia in 2018. They warned that companies would struggle to refinance rising debt loads, just as rates rise and a tide of 'tourist' investors who'd dabbled in riskier debt abandon ship.
"It's a wake-up call that central banks are withdrawing liquidity, and that the process is not going to be smooth," the Morgan Stanley strategists wrote.
As for the punchline, we go to Federated Investors' trader Gene Neavin: "As the days of low inflation, low rates and low volatility are coming to an end, investors are realizing that the Fed party is over."
As usual, equities won't care until after the wake up call.