MARKET FLASH:

"It seems the donkey is laughing, but he instead is braying (l'asino sembra ridere ma in realtà raglia)": si veda sotto "1927-1933: Pompous Prognosticators" per avere la conferma che la storia non si ripete ma fà la rima.


martedì 21 gennaio 2020

A World Gone Mad


A World Gone Mad
Today we gasp, stagger, reel.
The enormity of it all has finally overmatched our capacities. Consider…
Total global debt presently piles up to 322% of GDP — a record.
Total "developed world" debt piles higher yet — 383% of GDP — another record.
The world's stock markets combine to $88 trillion, or 100% of global GDP. That is another record yet.
Record upon record upon record has come down… as debt has gone relentlessly up.
And what does the world have to show for the deluge?

Little Bang for the Buck

Real United States GDP growth gutters along under 2%. Fair estimates place European and Japanese 2020 growth under 1%.
Interest rates, meantime, are coming down. And so the supply of "dry powder" available to the central banks is coming down. They will require heaps of it come the next crisis.
Project Syndicate, in summary:
The major developed economies are not only flirting with overvalued financial markets and still relying on a failed monetary-policy strategy, but they are also lacking a growth cushion just when they may need it most.
Direct your attention now to the Bank of England. Specifically, to its balance sheet…

Where's the Crisis?

As a percentage of GDP…
Not once in three centuries has this balance sheet swollen to today's preposterous extreme…
Not when England was life and death with Napoleon, not when England was life and death with the kaiser, not when England was life and death with Hitler:


The Bank of England's balance sheet — again, as a percentage of GDP — presently nears 30%.
It never cleared 20% even when England was absorbing obscene debts to put down Herr Hitler.
Where is today's Napoleon? Where is today's kaiser? Indeed… where is today's Hitler?
Yet the balance sheet indicates England is battling the three at once. And on 1,000 fronts the world across.
We razz English people only because the Bank of England is nearly the oldest central bank going (est.1694) and keeps exquisite records.
It therefore offers a detailed, three-century sketch of central banking's shifting moods.
Our own Federal Reserve's history stretches only to 1913. But its compressed history offers a parallel example…

Crisis-Level Balance Sheet

Its balance sheet expanded to perhaps 20% of GDP against the twin calamities of the Great Depression and Second World War.
It then came steadily, inexorably and appropriately down, decade after decade. Pre-financial crisis… that percentage dropped to a stunning 6%.
But then the great quake of '08 rumbled on through… and shook the walls of Jericho to their very foundations.
The Federal Reserve got out its mason kits and set to patching the damage.
Patching the damage? It built the walls up higher than ever…
By 2014 quantitative easing and the rest of it swelled the balance sheet to 25% of GDP. That, recall, is five full percentage points above its 20th-century crisis peaks.
Mr. Powell's subsequent quantitative tightening knocked down some of the recent construction.
The balance sheet — as a percentage of GDP — slipped beneath 20% by 2018.

But last year he pulled back the sledgehammers. Then, in September, the short-term money markets began giving out… and Powell rushed in with the supports.

The Fastest Expansion Ever

He has since expanded the balance sheet some $400 billion in a four-month span — over 10%. Not even the financial crisis saw such a violent expansion.
As we have presented before, the visual evidence:


The balance sheet presently nears $4.2 trillion, only slightly beneath its 2015 maximum.
Here then is irony…

"A Magnet for Trouble"

Observe the 2012–14 comments of Carlyle Group partner Jerome Powell — before he was Federal Reserve chairman Jerome Powell:
I have concerns about more purchases. As others have pointed out, the dealer community is now assuming close to a $4 trillion balance sheet and purchases through the first quarter of 2014. I admit that is a much stronger reaction than I anticipated, and I am uncomfortable with it for a couple of reasons.
First, the question, why stop at $4 trillion? The market in most cases will cheer us for doing more. It will never be enough for the market. Our models will always tell us that we are helping the economy, and I will probably always feel that those benefits are overestimated…. What is to stop us, other than much faster economic growth, which it is probably not in our power to produce?…
[W]hen it is time for us to sell, or even to stop buying, the response could be quite strong;there is every reason to expect a strong response…
Continues the present chairman:
My [next] concern… is the problem of exiting from a near $4 trillion balance sheet… It just seems to me that we seem to be way too confident that exit can be managed smoothly. Markets can be much more dynamic than we appear to think…
I think we are actually at a point of encouraging risk-taking, and that should give us pause…
I kind of think that a large balance sheet might prove to be a magnet for trouble over time… So I tentatively land on a floor system with the smallest possible balance sheet…
"Why stop at $4 trillion?"… "It will never be enough for the market"… "faster economic growth, which it is probably not in our power to produce"… "a large balance sheet might prove to be a magnet for trouble over time"… "I tentatively land on a floor system with the smallest possible balance sheet"…
Again — here is irony.

What Happened to Powell?

Where a fellow stands often depends upon where he sits. And this particular fellow sits in the chairman's seat at the Federal Reserve.
The Federal Reserve has a certain institutional… perspective.
And so he leans whichever way it slants.
Our co-founder Bill Bonner puts it this way:
"People come to believe whatever they must believe when they must believe it."
What does Mr. Powell's 2012–14 self, the conscience tapping naggingly on his shoulder, tell him?
That no enormity is ever enough for the market? Something about a magnet for trouble? A preference for the smallest possible balance sheet perhaps?
But Jerome Powell has come to believe what he must… when he needed to believe it.
We shudder at what he will come to believe come the crisis — or whatever his successor will come to believe.
Meantime, the world runs to record debt, its stock markets run to record highs…
And we are about ready to run for the Hills…
Platts: 7 Commodity Charts To Watch This Week

This week's pick of energy and commodity market trends kicks off with EU biofuels demand prospects and a window of opportunity for Australian crude oil grades. US and European gas market dynamics and Brazilian corn prices are also in the sights of S&P Global Platts news editors this week.

1. Renewables goals boost global biofuels demand

Goldman's Currie Is Watching Three Commodities Themes in 2020

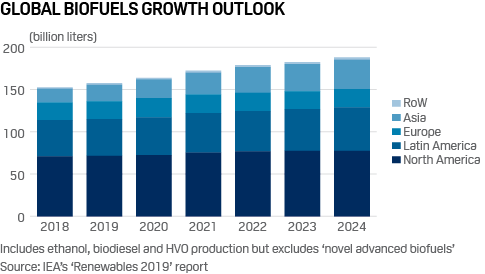
What's happening? In 2020, each EU member country will need to meet specific national renewable energy targets set by the European Commission. One route is to blend more biofuels into road fuels, with more countries adopting E10 gasoline, which contains up to 10% ethanol, twice as much as the current E5 standard. In 2019, the Netherlands became the latest European country to introduce E10 gasoline, following Finland, Belgium, France and Germany.

What's next? In France, E10 sales have now overtaken E5 deliveries. Growth of the E10 ethanol blend have been hindered in Germany by consumer belief that it could harm car performance. Meanwhile, the UK has yet to introduce E10 despite a very ambitious clean energy target, because most fuel stations do not have enough tanks to offer both E5 and E10 simultaneously. The US adopted tier 3 standards on 1 Jan 2020, which means less sulfur in the fuel and lower exhaust emissions of nitrogen oxides. India will move to BS VI specifications which limit the sulfur levels for road fuels to a maximum 10ppm from April 2020. China is implementing Euro 6 equivalent fuel standards and favoring higher levels of ethanol and biodiesel in the blend. The move has been phased in from 2019 and should be completed country-wide by 2022.

2. Aussie crude grades command high premium in IMO 2020 setting

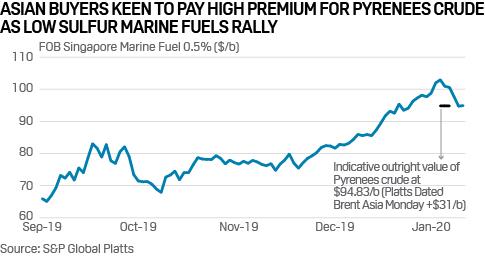
What's happening? Australian heavy sweet crudes including Pyrenees and Van Gogh are widely seen as ideal for blending into low sulfur marine fuels due to the grades' rich fuel oil yield, very low sulfur content and unique specifications such as low pour point and high flash point, industry and Asian refinery sources have told Platts. With demand for low sulfur fuel oil outpacing supply in Singapore, the world's biggest bunkering hub, the price of Marine Fuel 0.5% has spiked by more than 185% month on month, Platts data showed.

What's next? Australia looks set to reap the benefits of the International Maritime Organization's global sulfur cap as the country's heavy sweet crude oil is widely considered one of the best feedstocks for making IMO-compliant marine fuels – and many Asian refiners are willing to pay lofty spot premiums for it. Australian oil and gas producer Santos recently sold a 550,000-barrel cargo of Pyrenees crude for loading over March 4-8 to a Japanese buyer at a premium of around $31/b to Platts Dated Brent crude assessments on an FOB basis, essentially making the Australian oil the most expensive grade in the world. Asian refiners will likely compete for more Australian heavy sweet crude oil, with several cargoes of Van Gogh crude for loading in March up for grabs this week in the regional spot market.

3. German offshore wind stepping up to energy transition plate

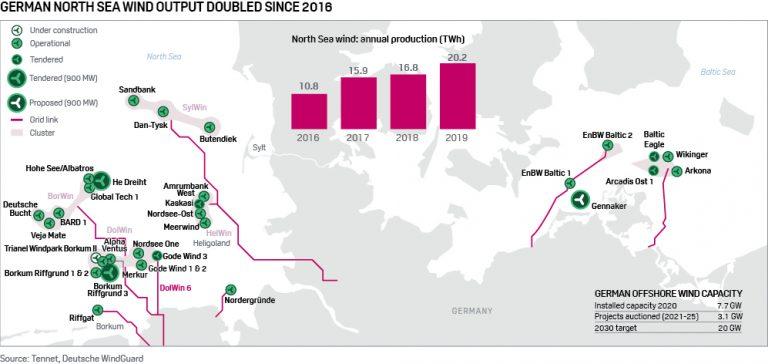
Click to enlarge

What's happening?  German offshore wind generation has doubled since 2016, with turbines in the North Sea generating as much electricity last year as two large nuclear power reactors running at baseload. Offshore turbines are playing an increasingly material role in wind's overall ascendancy to the Number One spot in Germany's generation mix. With over 7 GW installed in German waters, project commissioning in the North Sea is set to take a breather until 2022, with the focus switching to Baltic Sea projects.

What's next?  More is being asked of German offshore wind in the longer term. Berlin has upped its 2030 target by 5 GW to 20 GW, to help fill the gap left by nuclear and coal closures. The target is challenging because of grid constraints and reduced offshore acreage availability. One way to counter the grid constraint issue could be to produce green hydrogen at sea or coast. The concept is early-stage but the world's leading offshore wind developer, Orsted, has already bid a joint offshore wind/green hydrogen project into a Dutch auction and is determined to pursue the idea.

4. Specter of negative gas prices looms over Permian Basin…

What's happening? Balance-2020 forwards gas prices at the West Texas Waha hub tumbled to a record low in mid-January as the market outlook for available pipeline capacity exiting the Permian Basin continues to deteriorate. At market close on January 15, the forward curve dipped to its lowest on record at just 49 cents/MMBtu. Shoulder season prices for this year have faced even more downward pressure with the April contract falling to just 7 cents/MMBtu.

What's next? As Permian output continues to build, hitting a record high at 12.4 Bcf/d recently and averaging 11.5 Bcf/d over the past month, market jitters over midstream constraints have reemerged. Concerns about the possible return of negative prices this year were exacerbated following Kinder Morgan's third-quarter earnings call in October when executives announced a three-month delay to startup of the company's 2.1 Bcf/d Permian Highway Pipeline. The pipeline was originally scheduled to enter service in late 2020 but has since been delayed to Q1 2021.

5. …while EU's huge gas overhang limits Ukraine transit

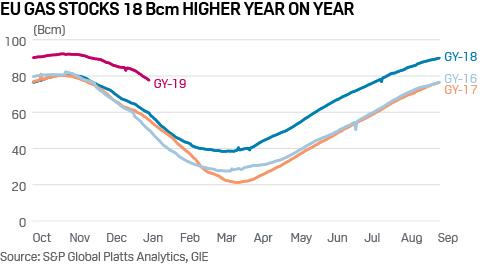
What's happening? Natural gas stocks across the EU are currently at around 77 Bcm – some 18 Bcm above the levels at the same time last year – helping to keep a lid on prices already pressured by warm weather and weak demand. To put that surplus into context, the additional stocks represent only a little less than the total pipeline exports from Algeria – considered a key European gas supplier – to Europe in 2019. Stocks across Europe were built up to record highs by the end of 2019 on fears that Russian gas transit via Ukraine to Europe could be disrupted.

What's next? Withdrawals across the EU have stepped up since the start of 2020 to some 450 million cu m/d as Russian deliveries slumped despite the transit deal. Gazprom itself was aiming to build up more than 11 Bcm in storage in Europe and may be withdrawing that gas rather than flowing via Ukraine to avoid keeping gas in storage any longer than necessary.


6. Ethanol, meat industry keep Brazil corn prices supported

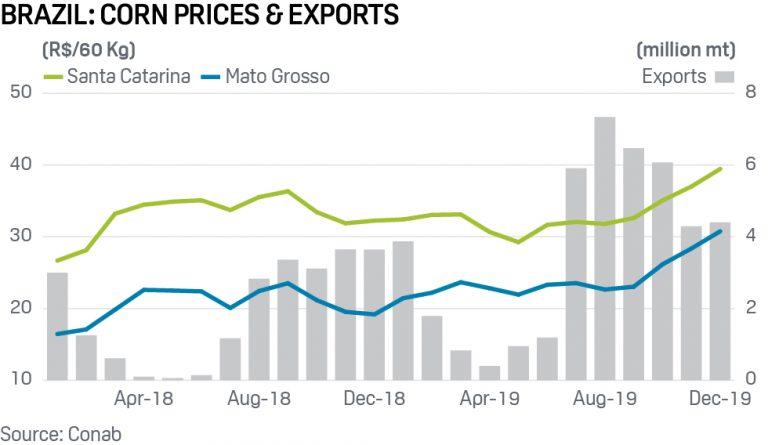
What's happening? Corn prices in Brazil, the world's largest corn exporter in 2019, have risen considerably over the last few months. Mato Grosso, the largest grain-producing state in the country, saw a sharp price increase because of record exports in 2019 and higher consumption by the ethanol industry. The feed industry in southern states also drove up prices as they paid a higher premium for corn to secure food supply for pork and poultry farms.

What's next? Domestic corn prices in Brazil are seen firm as meat exports from the country are expected to rise in 2020 on higher demand from Asia. Higher prices for corn in Brazil, especially in southern states, are likely to force the animal protein industry to buy more corn from neighboring countries. Moreover, higher local corn prices could also reduce the availability of the grain for exports.

7. Renewables focus could expand reach of US cap-and-trade

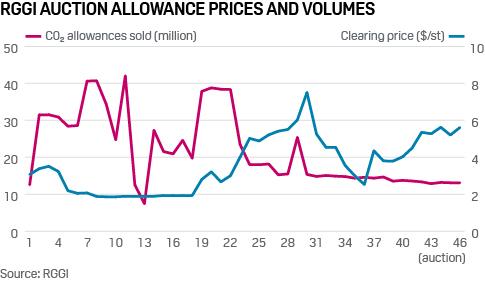
What happening? The Regional Greenhouse Gas Initiative issued the auction notice for the 47th quarterly carbon dioxide allowance auction that will take place March 11. There will be 16,208,347 CO2 allowances for sale, 24% more than the previous auction, with a minimum reserve price of $2.32/st. Plants in RGGI states must purchase an allowance for each ton of CO2 that they emit. Applications must be submitted by January 29.

What's next? As the focus on renewables intensifies in the US and the RGGI market matures, more states are looking to join the regional cap-and-trade program. RGGI states currently include Connecticut, Delaware, Maine, Maryland, Massachusetts, New Hampshire, New Jersey, New York, Rhode Island and Vermont. New Jersey rejoined January 1 after an eight-year hiatus. Other states that could join RGGI include Virginia, whose joining has been postponed, and Pennsylvania, whose governor issued an executive order in October instructing the state Department of Environmental Protection to join RGGI.