MARKET FLASH:

"It seems the donkey is laughing, but he instead is braying (l'asino sembra ridere ma in realtà raglia)": si veda sotto "1927-1933: Pompous Prognosticators" per avere la conferma che la storia non si ripete ma fà la rima.


martedì 23 gennaio 2018

Bob Shiller Warns World's "Priciest Stock Market" Could "Absolutely Turn Suddenly"

Nobel Prize-winning economist Robert Shiller told CNBC Tuesday that a market correction could come at any time and without warning...

"People ask 'well what will trigger [a market correction]?' But it doesn't need a trigger, it's the dynamics of bubbles inherently makes them come to a sudden end eventually..."

Shiller, who won the Nobel Prize for Economics in 2013 for his work on asset prices and inefficient markets, said that markets could "absolutely suddenly turn" and that he believed the bull market was hard to attribute totally to the U.S. political scene.

"The strong bull market in the U.S. is often attributed to the situation in the U.S. but it's not unique to the U.S. anyway, so it's hard to know what the world story is that's driving markets up at this time, I think it's more subtle than we recognize,"

Additionally Shiller writes in Project Syndicate that it is impossible to pin down the full cause of the high price of the US stock market, warning that this fact alone should remind all investors of the importance of diversification, and that the overall US stock market should not be given too much weight in a portfolio.

The level of stock markets differs widely across countries. And right now, the United States is leading the world. What everyone wants to know is why – and whether its stock market's current level is justified.

We can get a simple intuitive measure of the differences between countries by looking at price-earnings ratios. I have long advocated the cyclically adjusted price-earnings (CAPE) ratio that John Campbell (now at Harvard University) and I developed 30 years ago.

The CAPE ratio is the real (inflation-adjusted) price of a share divided by a ten-year average of real earnings per share. Barclays Bank in London compiles the CAPE ratios for 26 countries (I consult for Barclays on its products related to the CAPE ratio). As of December 29, the CAPE ratio is highest for the US.

https://www.zerohedge.com/sites/default/files/inline-images/20180123_shiller.jpg

Let's consider what these ratios mean. Ownership of stock represents a long-term claim on a company's earnings, which the company can pay to the owners of shares as dividends or reinvest to provide the shareholders more dividends in the future. A share in a company is not just a claim on next year's earnings, or on earnings the year after that. Successful companies last for decades, even centuries.

So, to arrive at a valuation for a country's stock market, we need to forecast the growth rate of earnings and dividends for an interval considerably longer than a year. We really want to know what the earnings will do over the next ten or 20 years. But how can one be confident of long-term forecasts of earnings growth across countries?

In pricing stock markets, people don't seem to be relying on any good forecast of the next ten years' earnings. They just seem to look at the past ten years, which are already done and gone, but also known and tangible.

But when Campbell and I studied earnings growth in the US with long historical data, we found that it has not been very amenable to extrapolation. Since 1881, the correlation of the past decade's real earnings growth with the price-earnings ratio is a positive 0.32. But there is zero correlation between the CAPE ratio and the next ten years' real earnings growth. And real earnings growth per share for the S&P Composite Stock Price Index over the previous ten years was negatively correlated (-17% since 1881) with real earnings growth over the subsequent ten years. That's the opposite of momentum. It means that good news about earnings growth in the past decade is (slightly) bad news about earnings growth in the future.

Essentially the same sort of thing happens with US inflation and the bond market. One might think that long-term interest rates tend to be high when there is evidence that there will be higher inflation over the life of the bond, to compensate investors for the expected decline in the dollar's purchasing power. Using data since 1913, when the consumer price index computed by the US Bureau of Labor Statistics starts, we find that the there is almost no correlation between long-term interest rates and ten-year inflation rates over succeeding decades. While positive, the correlation between one decade's total inflation and the next decade's total inflation is only 2%.

But bond markets act as if they think inflation can be extrapolated. Long-term interest rates tend to be high when the last decade's inflation was high. US long-term bond yields, such as the ten-year Treasury yield, are highly positively correlated (70% since 1913) with the previous ten years' inflation. But the correlation between the Treasury yield and the inflation rate over the next ten years is only 28%.

How can we square investors' behavior with the famous assertion that it is hard to beat the market? Why haven't growing reliance on data analytics and aggressive trading meant that, as markets become more efficient over time, all remaining opportunities to secure abnormal profits are competed away?

Economic theory, as exemplified by the work of Andrei Shleifer at Harvard and Robert Vishny of the University of Chicago, offers ample reason to expect that long-term investment opportunities will never be eliminated from markets, even when there are a lot of very smart people trading.

This brings us back to the mystery of what's driving the US stock market higher than all others. It's not the "Trump effect," or the effect of the recent cut in the US corporate tax rate. After all, the US has pretty much had the world's highest CAPE ratio ever since President Barack Obama's second term began in 2013. Nor is extrapolation of rapid earnings growth a significant factor, given that the latest real earnings per share for the S&P index are only 6% above their peak about ten years earlier, before the 2008 financial crisis erupted.

Part of the reason for America's world-beating CAPE ratio may be its higher rate of share repurchases, though share repurchases have become a global phenomenon. Higher CAPE ratios in the US may also reflect a stronger psychology of fear about the replacement of jobs by machines. The flip side of that fear, as I argued in the third edition of my book Irrational Exuberance, is a stronger desire to own capital in a free-market country with an association with computers.

The truth is that it is impossible to pin down the full cause of the high price of the US stock market.

The lack of any clear justification for its high CAPE ratio should remind all investors of the importance of diversification, and that the overall US stock market should not be given too much weight in a portfolio.

"Tax Reform Is Now Fully Priced In"

Last week we showed that as part of the "new tax cut reality", 2018 EPS forecasts have soared in the past few weeks as analysts scrambled to boost their earnings forecasts for companies benefiting from the lower corporate tax rate. Well, as of today, that surge has made further headway, and as the latest Bank of America chart below shows, the S&P is now trading off a year end EPS forecast of roughly 152, nearly 7 points higher compared to October.

asd

Further, according to BofA estimates, the surge in year end EPS forecasts means that about 40-50% of the tax reform's benefit of $13 EPS is now backed in.

That, however, has prompted more concerns out of Morgan Stanley, which as a reminder last week  suggested that with S&P calls hitting an all time high, it is time to buy puts. Fast forward to today, when in a note released from Morgan Stanley's Mike Wilson, the chief equity strategist writes that he continues to hear both clients and commentators suggest that tax cuts have not been priced and the powerful extension of the rally the past few weeks has only emboldened those with that view.

Morgan Stanley then admits that "we have been surprised at how fast forward EPS estimates have moved up post the signing of the tax deal. We thought it would be more gradual as companies hesitated to provide clear and detailed guidance on how tax would affect 2018 EPS, or indicated that it might not be as exciting as some were hoping--like FAST and AXP."

Furthermore, as a counter to Bank of America, the exhibit below from Morgan Stanley shows "just how much has now been discounted with the almost parabolic move higher in forward S&P EPS from $145 to $152 in just 3 weeks."

Wilson then suggests that contrary to BofA's take, the tax cut is not only fully priced in, but the next move will be lower as multiples start to contract:

We have no beef with this increase and is generally in line with our estimate that tax cuts would add somewhere between $5-10 per share to S&P 2018 EPS. However, we are skeptical it will exceed $155 when all is said and done. Meanwhile, the multiple has also been rising suggesting the market is now expecting a further rise toward $155 or higher.

asd

And to underscore his bearish take on the ongoing meltup, Morgan Stanley's strategist writes that this strongly suggests that the "tax is fully priced, especially if one agrees with our view that multiples are likely to fall when the earnings revisions stop rising and investors recognize it's lower quality growth and they are staring at a massive deceleration in 2019--$155 2018 EPS implies close to 17% y/y growth. Based on that, we are hard pressed to see much more than 5% earnings growth in 2019 even if the late cycle economic expansion continues; hardly a foregone conclusion in our view."

Central Banks: From Coordination to Competition

This is one reason why I anticipate "unexpected" disruptions in the global economy in 2018.
The mere mention of "central banks" will likely turn off many readers who understandably have little interest in convoluted policies and arcane mumbo-jumbo, but bear with me for a few paragraphs while I make the case for something to happen in 2018 that will impact us all to some degree.
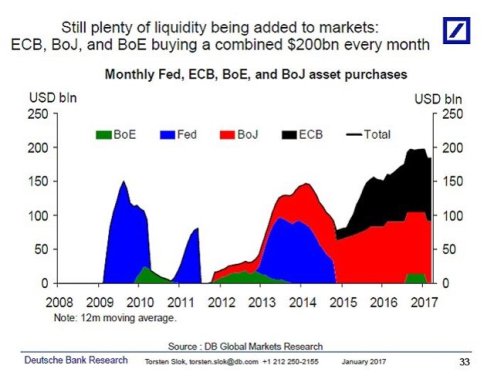
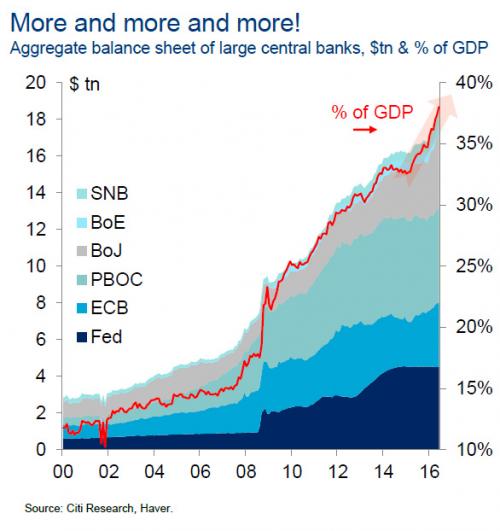
That something is the decay of the synchronized central bank stimulus policies that have pumped trillions of dollars, yuan, yen and euros into the global financial markets over the past nine years. Here are two charts that depict the "tag team" coordinated approach central banks have deployed: when one CB tapers its stimulus, another ramps up its money-creation/asset-purchases stimulus:
The balance sheets of all the primary central banks added together is astronomical:
This team effort is motivated by self-interest, of course; no one central bank can reflate the entire global economy, and yet that is the only way to reflate each nation/bloc's own economy, given the global connectedness of the modern economy.
But the threads of mutual self-interest are fraying. At this late stage in the credit cycle, the central banks must begin "tapering", i.e. diminishing and then ending their stimulus policies and eventually reducing their balance sheets by selling assets they bought in the stimulus phase (or simply stop replacing bonds they own that mature).
The Federal Reserve was first out of the gate in launching quasi-unlimited bond purchases, and it was the first central bank to cease stimulus (quantitative easing) and raise interest rates. It has now signaled that it will begin selling assets (i.e. stop replacing bonds that mature).
Those currencies/bonds that pay the highest interest (accounting for inflation, of will naturally attract global capital seeking a safe return above zero.
The net effect of this differentiation is that nations/blocs with near-zero yields will experience capital flight as money will flow to higher yields elsewhere.
The coordination of the stimulus phase will give way to nationalist self-interest in the tightening phase.
Those nations/blocs that need super-easy money and near-zero interest rates to keep their "growth" afloat will be drained of capital as capital goes to wherever it can earn more yield.
There's a further complicating factor: the relative strength of each nation's currency. This matters because as a currency appreciates, the issuing nation's exports cost more to buyers using their own currencies, and the nation with the appreciating currency loses the competitive edge of a cheap currency.
Since higher interest rates attract capital, they also tend to strengthen one's currency, as the relative value of currency is set by supply and demand: the more demand there is for the currency, the higher it goes relative the field of competing currencies.
There is a third factor as well: central banks need to reduce their balance sheets and raise interest rates, so they have some "policy accomodation" available to counter the next (and inevitable) recession/financial crisis.
The US has so far managed a hat-trick: it has raised interest rates a number of times, yet its currency, the US dollar, has lost over 15% of its value in 2017 compared to the Euro, which has gained 15+%.
There is a Darwinian twist to all this: any nation/bloc which manages to raise rates and end central bank stimulus without stifling its "recovery" or strengthening its currency to the point it hurts exports, and still be a global magnet for capital due to higher yields/rates, will have a substantial competitive advantage over its peers.
In effect, the self-interest that bound the central banks together in the stimulus phase reverses in the tightening/normalizing phase. Thus I anticipate a slow decay of central bank coordination and a rise of conflict/ competition, though this will of course be kept out of the media.
This is one reason why I anticipate "unexpected" disruptions in the global economy in 2018, as the coordinated stimulus phase ends and the disruptive, messy, Darwinian phase of tightening/ normalizing rates and balance sheets gathers momentum.