MARKET FLASH:

"It seems the donkey is laughing, but he instead is braying (l'asino sembra ridere ma in realtà raglia)": si veda sotto "1927-1933: Pompous Prognosticators" per avere la conferma che la storia non si ripete ma fà la rima.


venerdì 26 gennaio 2018

Sounds The Alarm: "Biggest Sell Signal In 5 Years Was Just Triggered"


One week ago, Bank of America's Michael Hartnett showed  that as a result of the ongoing stock market euphoria, the 4-week inflow into stocks had hit the highest ever, although he suggested that we were "not quite there" yet when it comes to euphoria becoming a "selling" trigger.


So fast forward one week, when according to BofA's latest weekly flow show, we finally made one-week history as investors poured the most money on record into equity funds, and warning that with the Bull & Bear indicator surging to 7.9 "the highest since last sell signal >8 triggered Mar'13", a tactical pullback in sky-high markets in February and March is now "very likely".
Overall, as part of what Hartnett calls a "non-stop euphoria cabaret" markets saw a record $33.2bn inflow to equity funds this week, record $12.2bn inflow to active funds, $1.5bn into gold (50-week high), as well as record inflows to tech & TIPS.
And while we all know how overbought the market is, here are two stunning statistics:
  • 98% of global equity markets trading above 50 & 200 day moving averages
  • AUM of SPY ETF now = GDP of Denmark.

Some further details on the historic inflows by region and product:
  • broken by region, it was more of the same as U.S. equities saw $7bn of inflows, Europe $4.6bn, Japan $3.4bn; while EM funds had the 2nd best week of inflows on record at $8.1bn.
  • On the credit IG bond funds gain $2b in 57th straight week of inflows, HY bond funds see outflows of $2.5b, EM debt inflows $1.6b
And while the rotation from debt to equity has not yet happened, a subset of debt - junk bonds - is clearly throwing in the towel, as shown in the chart below, which shows that equity flows relative to credit flows at all-time high (Chart 1 – HY redemptions 11/13 past weeks & slowing IG inflows); here Hartnett reminds us that "credit leads equities (except in bubbles)."
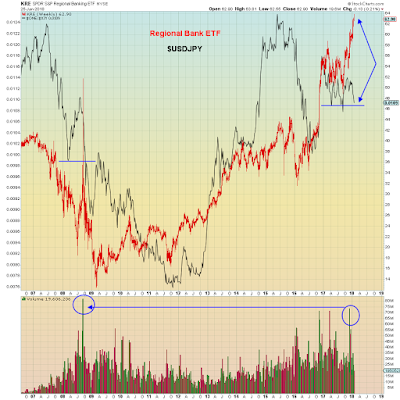
Looking at FX flows, BofA writes that as a result of the "tainted dollar", EM debt & equity inflows close to May'13 peak, which helps explain recent surge in EM currencies:
d
A little more euphoria and it will be time to sell emerging markets: "EM Equity Flow Trading Rule…$5bn into EM equities next week triggers 1st sell signal since Aug'14"
So going back to the BofA "sell signal" that was just triggered, Hartnett explains that the BofAML Bull & Bear indicator just surged to 7.9, highest since last sell signal >8 triggered Mar'13.
From here, inflows into HY/EM debt/equity funds would flip "soft sell" for risk assets to "hard sell".
Euphoria charted: BofAML GWIM private client equity exposure rising at fastest pace in 10 years...
... and cash allocation at record low (10%).
Should one trust the BofA Bull and Bear indicator? Well, yes: "BofAML Bull & Bear indicator has given 11 sell signals since 2002; hit ratio = 11/11; "
What happens next? Well, once hit, the average equity peak-to-trough drop following 3 months = 12% (backtested, Table 1); note the last Bull & Bear indicator flashed was a buy signal of 0 on Feb 11th 2016.
Putting it all together, BofA warns that a "tactical S&P500 pullback to 2686 in Feb/Mar now very likely."
And here is what can spark it:
"The Art of Falling Apart: US dollar key catalyst; note US-Europe FX spat sparked '87 crash; higher US$ "pain trade" = risk-off coming weeks; we reiterate 2018 calls: Big Long = Vol, Big Short = Credit, Big Risk = Equity Bubble (driven by $10.3tn of negatively yielding debt), Big Rotation from Davos Man to Joe-Six Pack portfolio"
Will this time finally be the charm for BofA's recurring warnings of an imminent market plunge? The next 2 months will reveal if - this time - it was finally right...

$11,589.01?... Ask The Swiss!

$11,589.01.


That's the US dollar amount of American stocks the Swiss National Bank owns on behalf of every man, woman and child in Switzerland.Let that sink in.
A Central Bank has taken on itself to expand its balance sheet and invest in the proceeds, not in gold, nor sovereign debt - heck not even in corporate bonds. Nope, the SNB has taken it upon itself to "invest" that money in another country's most risky part of the capital structure - equity.
And don't think it's a small number. It's almost $100 billion US dollars.
In a strange twist of fate, the Swiss National Bank is not only Switzerland's Central Bank, but also a publicly traded security. I know, it makes little sense, but in this day and age, what does? Anyways, the financial community is all abuzz with SNB's rocket ship chart formation.
The SNB's equity price market capitalization is only 584 million CHF, so when you consider that the S&P 500 is up almost 6% since the start of the year, and that the SNB owns $100 billion of stocks which are up $6 billion USD during the last two months, maybe it makes sense to take a punt of buying some SNB equity. Now, who really knows how to value this security? Those gains should accrue to Swiss citizens as opposed to SNB equity holders, but it's easy to understand the excitement.

The real problem

It's all fun and good to speculate on the SNB equity price, but I am more interested in what the SNB's behaviour means for the global markets going forward.
The real problem is that a Central Bank just monetized their balance sheet against another country's equity market, and instead of getting punished for this reckless behaviour, the markets are celebrating the Swiss good fortune. And I ask you - have you ever seen Central Bankers not behave like a bunch of antelopes on the Serengeti? It is an amazingly disturbing precedent.
The Swiss National Bank has gone down a rabbit hole from which it will be extremely difficult to surface. Not only does every Swiss citizen own indirectly through the Central Bank more than $10k of US stocks, but their total assets per capita is over $94,000 each!
Since the 2007 Great Financial Crisis, the SNB has taken the size of their balance sheet from 20% of GDP all the way to 125%!
And look at the period from 2014 to today. From 80% to 125%. And that was during a period of relative calm in both the markets and the economy.
What's going to happen when the global economy rolls over?
This sort of balance sheet expansion, and especially with the corresponding move out the risk curve, is complete madness.
I know many market strategists are issuing warnings about markets due to forecasted global Central Bank asset tapering. I sure hope they are correct that this insanity ends soon. But I worry that we are being naive.
Have you looked at the Federal Reserve's balance sheet lately? I know they are on a schedule to taper, but it's at a glacial pace.
I worry that right now, Central Banks are being rewarded for keeping their balance sheets as big and risky as they can stomach. It appears to be a trade with no cost, and in fact, helps out by both keeping their currency weak, and in the meantime, making some money. It encourages them to be extremely slow easing off the accelerator.
The idiocy of Central Banks taking this sort of risk is beyond description, but no sense arguing about it - it is what it is. But make no mistake, it's like wearing jeans, a denim shirt, and a jean jacket at the same time (the Canadian tuxedo), it just shouldn't be done (unless you are Ryan Gosling and then somehow the ladies seem to like it - go figure…)
I don't have any conclusions to draw from this diatribe. I don't think you should take this as some sort of apocalyptic warning about a coming crash. In fact, it's probably just the opposite. If this sort of Central Bank insanity continues at this pace even though the global economy is firmly in the green, then it only affirms my belief that Bill Fleckenstein was correct when he said, "the bubbles will continue until the bond market takes away the keys."
PS: If the Federal Reserve decided to invest $11,589 in the US stock market per American citizen, they would need to buy $3.75 trillion of stocks… That would mean they would have to almost double the already inflated balance sheet. That's the level of absurdity from the Swiss National Bank.

Massively Leveraged To Collapse

Wall Street's "best and brightest" conned themselves this time. Needless to say, these are not bright people. But they do enjoy blowing smoke up each other's asses...


What do Jeff Gundlach, Bill Gross, and Ray Dalio all have in common? - big time fund managers who lead Wall Street's consensus view that bond yields can only head higher. If only the economic data would confirm that view: 

ZH: Worst Start For Economic Data Since 2015


How does this happen? Ponzi reflation, how else. Today's gambling class are looking at self-reflecting indicators bid up by their own hedge funds. They've bid up oil and now tell themselves that oil is higher because the economy is getting stronger. Oil then feeds back into inflation rates, commodity baskets, S&P 500 profits, and equipment orders. Gamblers then take the cue from these artificially contrived reflation rates to buy banks, energy stocks and transports, in the groupthink belief that the 'Conomy is expanding.


Ponzi reflation visualized:


But if they really wanted to know about forward reflation, they could ask the bond market itself, which has only now reached the level of last March. Why is that important: because that's when the reflation rally stalled last year. 


Unfortunately for gamblers, stocks are now massively leveraged to Ponzi reflation:


Which just means that they are leveraged to economic collapse:


Now we know which one of these was right:


Any questions?