MARKET FLASH:

"It seems the donkey is laughing, but he instead is braying (l'asino sembra ridere ma in realtà raglia)": si veda sotto "1927-1933: Pompous Prognosticators" per avere la conferma che la storia non si ripete ma fà la rima.


giovedì 15 marzo 2018

Blain: "10 Years Ago Bear Stearns Collapsed; Larry Kudlow Was Its Chief Economist When I Joined"

The Ides of March, 10-yrs after Bear Stearns can it happen again? Doh!

The World is a curiously circular place. 10-years ago the collapse of Bear Stearns and its subsequent rescue by JP Morgan ushered in the panic stage of the Global Financial Crisis. The cataclysm came 6 months later when Lehman went down. Yesterday, Donald Trump appointed CNBC Commentator Larry Kudlow to Gary Cohn's job as director of the NEC.Kudlow was chief economist of Bear when I joined the firm in the early 1990s.

I'm kind of bemused at Kudlow's appointment, but it proves what an adaptable crow Bear alumni are. Bear was a fantastic place to work. We lacked the glib polish of Goldman Sachs, the white-shoe smoothness of Morgan Stanley, the mighty balance sheets of Citi or JP Morgan, and the depth and range of Merrill, but we were united as the smart yappy mammals snapping round the ankles of the Wall Street dinosaurs. Over the next 10 years we stole a mighty share of their lunches! We did it with aplomb, style and underlying honesty – we were brutally open with our clients: we would succeed by making their deals successful. It was the best of times, and I'm still in touch with many of my clients from these days.

When I was there, the mantra of Ace Greenburg ran the firm – absolute honesty on the trading floor and instant death to anyone skirting the rules. His "Memos from the Chairman" was classic: look after the pennies and the dollars will come, hire PSD graduates: "poor, smart and a deep desire to get rich", and whenever you receive a paperclip in the post, save it up to send back to a client. We calculated not buying paperclips saved Bear about $100 per annum, but, heck, it worked!

The question today is could it all happen again? Bear Stearns was brought down by the same collapse in confidence caused by the mortgage shock that sank so many of other financial institutions. Back in 2007 the banks were loaded to the gills with leveraged product on the back of the "originate to sell" model – RMBS, CDOs and the many leveraged derivatives of these "toxic" investments.

Today? The world has changed.

Draconian capital regulations and the "hunt for yield", (caused by central bank ZIRP and NIRP unconventional monetary policy), means most of the risk is more broadly spread across the whole financial environment. Ultimately all the risks laid off by banks and other originators resides somewhere – in insurance companies, hedge funds, credit funds and our pension savings. Risk does not disappear. It just gets spread around – meaning everyone hurts.

10-years of unconventional monetary policy has changed the investment equation – yields are low and spreads between risk asset classes are compressed to levels that simply don't make risk-sense to those of us who remember the 1980s and 90s. QE has caused inflation – just not where you were looking for it. Its abundantly visible in inflated stock and bond prices. On the other hand – unconventional monetary policy in the form of QE and Low interest rates worked. It kept the financial markets functional.

Now we have synchronous global growth. Estimates all point to continued strength through the next few years. We expect 20% GNP growth over the next 5 years – in theory more than enough to justify current investment valuations. Unconventional is the watchword for the next few years – when else have you seen a nation slashing taxes at the same time as its central bank is considering hiking rates? Or when else has an economy like China successfully moved from export led to a consumption driven model? Populism – the like of which elected Trump – means fiscal policy is back in vogue – infrastructure spend even as the economy recovers?

Yet there are significant risks – liquidity is a major one. Yesterday I read that not a single JGB traded on the Japan bond market. Back when I were young we were trading trillions of yen per day. Now the BOJ owns most of the market. There is no guaranteed liquidity in any bond market – the banks don't take market-making risk if they don't have to. Capital can be arbitraged far more cleanly away from underwriting market risks. Once more let me remind you: the New York Stock Exchange has 27 doors saying "Entrance". There is only one market "Exit".

Then there is geo-politics.

While Trump is getting away with it thus far, at what point do roadblocks arise as he tries to discipline multiple countries from a USA perspective? What are the risks the Chinese stage a Treasury firesale and buyer-strike (Clue: its far less likely than feared as there is literally nowhere else to park their dosh, but its still a fear).

Then there is politics – what are the implications of populism and the long-term threat of increasing income inequality.

These are just the known threats. What about the "no-see-ums"? Every 10-yrs or so something whaps markets like a well wielded wet-kipper across the face. Maybe it's a regional crisis, or a financial instrument class exploding, a taper-tantrum, an investment bubble like dot-coms or tulips, or a deeper than expected bear reversal. Confidence is a very fickle thing.

There are a number of known-market truths – like "countries can't go burst" that have been brutally exposed over the centuries. Maybe it will be European Sovereign Credits? Who knows? What else is wobbling and we just ain't aware of it yet?

What I do know is people who say: "this time its different", are invariably wrong. I shall have a quiet toast to Bear later today.

Import, Export Prices Signal China Now Exporting Inflation

Following a mixed bag from CPI and PPI data, both import and export price inflation slowed YoY in February.

While import prices rose more than expected from January (+0.4% MoM vs +0.2% exp), export prices rose less than expected.

China's 'export' prices appear to have bottomed...

Which means China is now sparking an inflationary (albeit very modest) push to the world...

"It's Time To Be Alert!"

This is the time to be alert for any signs of a failure in the S&P 500. Why? There are two really good historical precedents to the current market configuration.

The set-up is as follows: stocks suffer a rather quick correction, bounce back, take out the previous lows and experience a waterfall decline. The period of time from the bounce-back high to a new low was seven days.

Let's look at the 1929 crash to start. The S&P 500 peaked at 31.86 on September 16, 1929. Over the next 14 days, the index experienced a 10.08% correction. Then, over the next four days, stocks bounced back by 7.54%. What followed was a seven-day period of time where stocks drifted lower, and then on October 18, 1929 the low was broken and a waterfall decline ensued. The decline from October 8, 1929 to November 13, 1929 was a 22-day waterfall decline, with stocks dropping 42.68% into November 13, 1929.

The 1987 crash was a remarkably similar experience. Stocks peaked on August 25, 1987 and then began a 7.79% decline over 18 days. Stocks then rebounded by 5.65% over the following 10 days, peaking on October 5, 1987. Over the next seven days, the low failed and a waterfall decline followed. The decline was 28.51% over four days, culminating in a low on October 19, 1987.

In the last 40 days, we've seen the S&P 500 peak at 2872.87 on January 26. Stocks experienced a 10.16% correction over nine days, and then they bounced back by 7.96% over the next 20 days ending last Friday, March 9. We are now in that seven-day window where stocks need to hold up.

If, over the next seven days, we drift lower and take out the 2581 low of February 8, history suggests this is a set-up for a waterfall decline.

Through next Wednesday, it is time to be alert.

Which Do You Believe? The $USD or Fed Economic Forecasts?

The attempts to mask inflation are reaching truly ludicrous proportions.

Bloomberg reports that the "guts of the US CPI show key inflation weakest in years."

What are the "guts?"

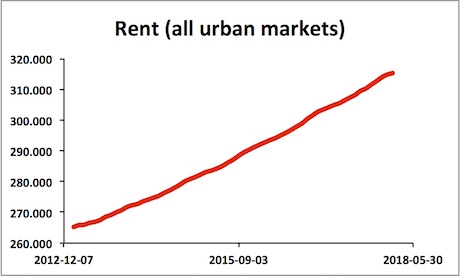
Housing rents… which the CPI claims are falling.

That's interesting, because:

1)   Apartment rents rose in 89% of US cities in January.

2)   Rents as a percentage of income are at their highest levels ever.

3)   The supposed "drop" in rents actually consisted of rents rising 2.7% Year over Year. The fact that it was the slowest rise in years is somehow supposed to mean rents fell.

At some point, someone needs to point out the obvious: that the entire reason the Fed uses CPI as an inflation measure is to HIDE, not accurately portray inflation.

Here's a chart of Rents for all Urban Markets in the US. If you believe that the trend is DOWN here I have a bridge to sell you.

GPC31418.jpg

The fact is that the Fed is desperately "massaging" the data to hide the reality that the inflation genie is out of the bottle.

The $USD has already figured this out, which is why it has been dropping like a brick, falling nearly 14% over the last 15 months.

Who are you going to believe? The $USD or Fed economic forecasts?

GPC314182.png

The Economist Warns "A Reckoning Looms" For America's Debt-Binged Companies

The total debt of American non-financial corporations as a percentage of GDP has reached a record high of 73.3%.

America's companies have been powering ahead for years. Amid growing profits, the recession that began in 2007 seems an increasingly distant memory. Yet the situation has a dark side: companies have binged on debt. For now, as the good times have coincided with a period of record-low interest rates, markets have been untroubled. But a shock could put corporate America into trouble.

No matter how it is measured, the debt load looks worrying. When calculated as a percentage of GDP, the total debt of America's non-financial corporations reached 73.3% in the second quarter of 2017 (the latest available data). This is a record high. Measured against earnings before interest, tax, depreciation and amortisation (EBITDA), the net debt of non-financial companies in the S&P500 hit a ratio of 1.5 at of the end of 2016, a level not seen since 2003. And it remained nearly as high in 2017 (see chart).

To be sure, things are less worrying than they were before the financial crisis. According to a recent analysis by S&P Global Ratings, a ratings agency, for example, debt is now more evenly distributed. Only 27% of American firms in 2017 were highly levered (defined as a debt-to-earnings ratio higher than five), down from 42% of firms in 2007, meaning that fewer firms are immediately at risk.

The use of the extra debt was also somewhat different. Bob Michele of J.P. Morgan reckons that in recent years much of it was used by companies to finance share buy-backs, essentially for purposes of balance-sheet management (rather than, say, big expansions or acquisitions).

Even so, certain industries look particularly vulnerable under their debt loads. David Tesher of S&P Global Ratings says that retail is the sector in America most at risk. Such companies accumulated high levels of debt after more than a decade of private-equity-sponsored activity. They must also cope with tough competition from e-commerce. Around 50 American retailers filed for bankruptcy in 2017 alone, many due to the debt piled on by their private-equity owners. The most prominent example is Toys R Us, which was acquired by a consortium of private-equity firms in 2005. In the case of Payless ShoeSource, a retailer that also went bankrupt last year, creditors argued in court filings that its private-equity owners should share the blame for its collapse; after much argument, the owners agreed to put more than $20m back into the company.

Energy and utilities are two other industries at risk from their levels of indebtedness. The net debt-to-EBITDA ratio of the energy industry rose to three times by 2016, largely because of the shale-oil boom. But firms then issued a substantial amount of new equity. As earnings recovered with the rise in oil prices, their debt ratio improved to two times by last year. Utilities, meanwhile, which have always borrowed heavily, saw their debt rise to a 14-year high of 4.5 times earnings in 2017.

America's new tax reforms add extra complications. Despite being welcomed by most businesses, the impact on firms' willingness and ability to take on debt is uneven. For many, the lowering of the headline corporate-tax rate from 35% to 21%, as well as provisions such as the ability to expense capital spending up front, will boost profits and thus reduce the need to take on new debt (unless bosses go on a buying spree). But the new law also caps the (previously unlimited) tax deductibility of interest payments at 30% of EBITDA until 2021, falling to a more restrictive 30% of earnings before interest and taxes (but after depreciation and amortisation) from 2022. This provision will hit the most indebted firms hard, notably those owned by private equity, as well as industries such as utilities.

How quickly debt levels turn into a problem depends on monetary policy and how the economy fares.

In a benign scenario, in which corporate earnings rise across the board, and the Federal Reserve raises interest rates at a slow and predictable pace, companies' debt ratios may even fall, for now.

But if more worrying scenarios—say, a trade war, or significantly faster-than-expected monetary tightening—come to pass, more indebted companies may find their luck running out. A binge, after all, never lasts forever.

"They Killed The Market" - Not A Single Japanese Bond Traded On Tuesday

Bank of Japan Governor Kuroda appeared to somewhat proudly proclaim last night during his address to government that the BoJ has bought 75% of JGBs issued in fiscal-year 2017 so far! (and yet we are reassured that this is not debt monetization... not all).


"Yields in Japan are stable" Kuroda added... One glimpse at the chart below and its clear how 'stable' the Japanese bond market has become - reminding us somewhat of Monty Python's Dead Parrot sketch. As one veteran bond trader exclaimed, "they killed the biggest bond market in the world."


This is "the result of YCC [Yield Curve Control] policy" he bragged, before admitting that it "would be hard to continue YCC if trust in debt was lost," but Kuroda reminded his audience that "because BoJ has seigniorage, trust in yen won't be lost."

But is that trust starting to fade?

As Bloomberg notes, The Bank of Japan has vacuumed up so much of the government bond market -- in excess of 40% -- that it's left fewer securities for others to buy and sell. Some other buyers, such as pension funds and life insurers, also tend to follow buy-and-hold strategies.


That's the backdrop to Tuesday's session, when not a single benchmark 10-year note was traded, according to Japan Trading Co. Naoya Oshikubo, a rates strategist at Barclays Securities Japan summed it up, with perhaps an understatement: "the JGB market was generally thin."

Despite the total and utter lack of liquidity in the once most liquid segment of the JGB curve, Kuroda confidently went to explain the central bank could engineer a smooth exit from its ultra-loose monetary policy, but said it was too early to debate specifics with inflation still distant from its target.

"By combining various tools, it's possible to shrink the BOJ's balance sheet at an appropriate pace while keeping markets stable," Kuroda told parliament, when asked by a lawmaker about a BOJ exit strategy.

Just one quick question Kuroda-san - how the fuck are you going to be able to step back when you bought 75% of JGB issuance this year so far?

As more market participants throw in the towel on a rigged, centrally planned market, the result will - no could - be a further loss of market function, and a guaranteed crash once the BOJ and other central banks pull out (which is why they can't).

As the Nikkei politely concluded, "if the bond and money markets lose their ability to price credit based on future interest rate expectations and supply and demand, the risk of sudden rate volatility from external shocks like a global financial crisis will rise.