Summary
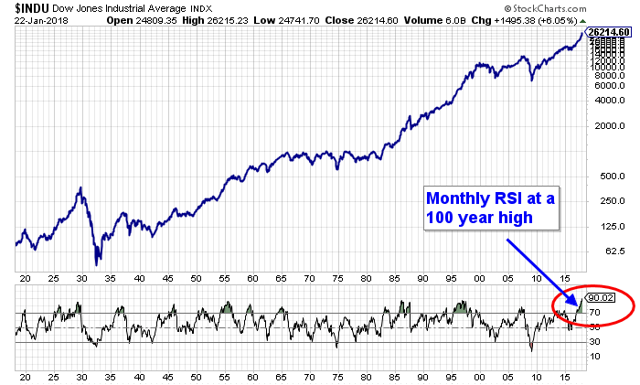
The monthly relative strength index (RSI) on the Dow Jones Industrial Average is at a record high and is at near record levels for the S&P 500.
High RSI values indicate extremely overbought conditions with an increased risk of a market decline.
The cyclically adjusted price-earnings (CAPE) ratio of the S&P 500 is well above historical means, indicating overvalued stock prices.
CAPE values corrected using alternate inflation data indicate downside risk is significant.
Investors may consider protecting themselves by increasing allocation to less overvalued sectors, such as energy and utilities, or investing outside the United States.
Currently, one of the most stunning indications of the overbought conditions in the stock market is the record levels of the monthly relative strength index (RSI). For the Dow Jones Industrial average, the monthly RSI is higher than it has ever been in the past 100 years:
A similar plot of the S&P 500 going back as far as 1925 also reveals near record levels for the monthly RSI:
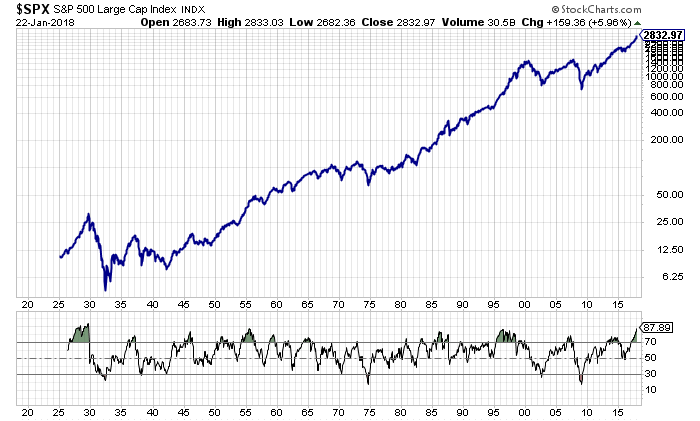
The record highest levels for the monthly RSI on the S&P index occurred in the years 1927-1929 just before the Great Depression began. We are not at those extreme levels for the RSI on the S&P 500 yet, but could be quite soon if stock prices continue to climb as they have recently.
The high RSI value indicates strong upward price momentum and overbought conditions. Similarly high RSI values were observed in the months leading up to all major market crashes, including the Black Tuesday crash of 1929, the Black Monday crash of 1987, the popping of the tech bubble in 2000, and the 2008 crash following the great financial crisis.
Nessun commento:
Posta un commento