MARKET FLASH:

"It seems the donkey is laughing, but he instead is braying (l'asino sembra ridere ma in realtà raglia)": si veda sotto "1927-1933: Pompous Prognosticators" per avere la conferma che la storia non si ripete ma fà la rima.


lunedì 5 febbraio 2018

Fed’s QE Unwind Accelerates Sharply

With a sense of urgency. No more dilly-dallying around.

The Fed’s balance sheet for the week ending January 31, released this afternoon, completes the fourth month of QE-unwind. And it’s starting to be a doozie.

This “balance sheet normalization” impacts two types of assets: Treasury securities and mortgage backed securities (MBS) that the Fed acquired during the years of QE and maintained afterwards.

The Fed’s plan, as announced in September, is to shrink the balances of Treasuries and MBS by up to $10 billion per month in October, November, and December 2017, then to accelerate the pace every three months. In January, February, and March 2018, the unwind would be capped at $20 billion a month; in Q2, at $30 billion a month; in Q3, at $40 billion a month; and starting in Q4, at $50 billion a month.

According to this plan, balances of Treasuries and MBS will shrink by $420 billion in 2018, by an additional $600 billion in 2019, and by an additional $600 billion every year going forward until the Fed deems the level of its holdings “normal.” Whatever this level may turn out to be, it will be much higher than the level suggested by the growth trajectory before the Financial Crisis.

For January, the plan called for shedding up to $20 billion: $12 billion in Treasuries and $8 billion in MBS.
So how did it go?

On its December 27 balance sheet, the Fed had $2,454 billion of Treasuries. By January 31, it had $2,436 billion: a drop of $18 billion in one month!

This exceeds the planned drop of $12 billion for January. But hey, over the holidays, most folks at the New York Fed, which does the balance sheet operations, were probably off and not much happened. And so this may have been a catch-up action, with a sense of urgency.

In total, since the beginning of the QE Unwind, the balance of Treasuries has plunged by $30 billion, to hit the lowest since August 27, 2014. This part of the QE Unwind is happening:


The jagged down movement in the chart is a result of the way the Fed unwinds its QE. It does not sell the securities. It allows them to “roll off” its balance sheet. It works this way:

Treasuries mature in mid-month and at the end of the month. For example, on January 31, about $27 billion of the Fed’s Treasuries matured. The Treasury Department redeemed those securities (normal bondholders would be paid face value). But the Fed has a special arrangement with the Treasury Department that cuts out the middlemen.

To maintain the level of Treasuries, the Fed would “roll over” these securities directly with the Treasury Department – replacing maturing securities with new securities.

But under the QE unwind, the Fed allows part of those securities to “roll off” rather than allowing them to “roll over.” In other words, the Fed does not replace some of the maturing securities and instead gets paid for them.

Of the $27 billion in Treasuries that matured yesterday, the Fed “rolled over” $16 billion (replaced them) and allowed $11 billion to “roll off” (got paid for them). The blue arrow in the chart above shows this big one-day move.
MBS: a jagged line and a lag of two to three months.

The Fed acquired residential MBS guaranteed by Fannie Mae, Freddie Mac, and Ginnie Mae as part of QE. Now, it’s supposed to shed them at a pace of $4 billion a month in Q4 last year and $8 billion a month in Q1 this year. So how did it go?

Residential MBS differ from regular bonds. The issuer (Fannie Mae et al.) passes through principal payments to MBS holders as underlying mortgages get paid down or get paid off. Thus, the principal shrinks in uneven increments until the remainder is redeemed at maturity.

To keep the MBS balance steady, the New York Fed’s Open Market Operations (OMO) buys MBS in the “to-be-announced market” (TBA market). The actual MBS is not designated at the time of the trade but will be announced 48 hours before the established settlement date, which can be two to three months later.

The Fed accounts for its MBS on a settlement-date basis. So there is a mismatch between the date the Fed receives principal payments and the date reinvestment trades settle. Hence the jagged line in the chart below.

Since MBS take two to three months to settle, the first declines weren’t expected to show up on the Fed’s balance sheet until sometime December. But since MBS balances have large weekly variations due to the timing issues, those early declines were hard to see.

This is why we look for “lower highs” and “lower lows” with a lag of two to three months, which is what we see in January, a reflection of trades that took place around November:


At the end of October, before the MBS Unwind became visible, the Fed held $1,770.2 billion in MBS, at the low point of the period. On today’s balance sheet, also the low point in the chart, the Fed shows $1,760.7 billion. From low to low, the balance dropped $9.5 billion. This reflects trades from two to three months ago. So even the MBS Unwind is now clearly visible.

In early December we hadn’t yet seen the MBS Unwind. About a month later, the NY Fed published an article including the reasons behind the jagged line and that MBS take two to three months to settle. So why all this noise in the overall balance sheet?

Total assets have dropped by $41 billion since the QE Unwind began, the lowest since September 3, 2014:


But why all this noise in the chart? The Fed has other roles that cause assets and liabilities to fluctuate. Among them: it is the official banker of the US government. The US Treasury keeps its cash balances on deposit at the Fed (rather than JP Morgan). When the balance fluctuates, is causes the Fed’s assets and liabilities to fluctuate, as they would with any bank.

Similarly, the Fed holds “Foreign Official Deposits” by other central banks and governments. And the Fed has other functions that impact the overall balance sheet. But movements caused by these functions have nothing to do with QE or with the QE Unwind.

For the QE Unwind, only Treasuries and MBS matter. And the Fed is shedding them — after everyone had said for years that it could never shed them. The Treasury market may be finally paying attention: The 10-year yield closed today at 2.78%, the highest since April 2014.

Just as the Fed accelerates its QE Unwind, and as Treasuries react, the government is planning to sell a massive pile of new debt.

Corporate Bond Market in Worst Denial since 2007

It's just a question of how disruptive the adjustment will be, whether 
it will be just a painful sell-off or junk-bond mayhem.

Treasury securities have been selling off and Treasury yields have been rising, with the two-year yield at 2.15% on Friday, the highest since September 2008, and the 10-year yield at 2.84%, the highest since April 2014. Rising yields mean that bond prices are falling, and this selloff has been an uncomfortable experience for holders of Treasury securities.

But corporate bonds have been in their own la-la-land, and even Tesla, despite its cash-burn rate that should scare the bejesus out of investors, was able to sell $546 million in bonds last week – bonds collateralized by lease payments it receives from customers that have leased its cars.

S&P rates Tesla "B-minus," a highly speculative rating just one notch above the deep-junk rating of triple-C. But no problem. Yield-desperate, risk-blind bond investors had the hots for these auto-lease-backed securities, according to Bloomberg:


The sought-after debt deal allowed Tesla to slash the risk premiums it would pay on the notes. They were sold to yield between 2.3 percent and 5 percent. At initial offered prices, investors had put in orders for as much as 14 times what the electric-car maker intended to sell on some slices of an asset-backed security, according to people familiar with the matter.

Junk-rated and cash-burning Netflix, or oil-and-gas companies drilling billions into their fracking endeavors, and many other junk-rated companies such as Fiat-Chrysler are in hog-heaven, with high demand for their debt, which pushes down the yield for investors and the costs of borrowing for the companies.

And the spread between average junk-bond yields and equivalent Treasury yields has now fallen to just 3.29 percentage points. That's the premium investors demand to be paid for taking on the additional risk of junk bonds versus Treasury securities.

This is the narrowest spread since July 2007, just before credit froze as the Financial Crisis began to unfold, and numerous of these junk-rated companies, cut off from further funding and losing money as they went, ended up in bankruptcy court, an experience during which stiffed bondholders and other creditors re-learned to appreciate the notion of risk.

This chart of the BofA Merrill Lynch US High Yield Option-Adjusted Spread, retrieved from the St. Louis Fed, shows the minuscule premium investors are currently demanding for holding high-risk junk bonds versus nearly risk-free Treasuries, and just how far in denial the corporate junk-bond market is:


Investment-grade bonds, issued by the corporations that are deemed to be financially among the most stable, are showing a similar pattern.

The premium investors demand to be paid for taking on the additional risk of corporate bonds versus Treasury securities has now dropped to just 90 basis points (0.9 percentage points), according to the BofA Merrill Lynch US Corporate Master Option-Adjusted Spread index. This is the lowest since March 2007. During the subsequent Financial Crisis, major investment-grade rated corporations – including GE – suddenly couldn't borrow anymore even to meet payroll, and the Fed, in its function as lender of last resort, began bailing them out with special loan programs.

The chart below of the BofA Merrill Lynch US Corporate Master Option-Adjusted Spread index, retrieved from the St. Louis Fed, shows the la-la-land that the corporate bond market thinks it's in:

Here's how this is going to work out:
The Fed will continue to raise its target range for the federal funds rate.
The 10-year yield will follow.
As the Treasury yield curve, which is still relatively flat, steepens back to some sort of normal-ish slope, the 10-year yield will make up for lost time over the past year and will rise faster than the Fed's target range for the federal funds rate.
Corporate bonds will follow, but they have even more catching up to do, and so they will rise even faster than the 10-year yield, as yield spreads between the 10-year Treasury and corporate bonds widen back to some sort of normal-ish range.

In other words, corporate yields will rise further and faster than Treasury yields, just to catch up, thus pushing down prices with gusto. Junk bonds are more volatile and will react more strongly. Junk-rated companies will find it more difficult to raise new money to service their existing debts and fund their money-losing operations, and there will be more defaults, which will push yields even higher as the risks of junk bonds suddenly become apparent for all to see. This will make it even tougher for companies to raise funds needed to service their existing debts and fund their operations.

This is not a secret. It's just how it works. The initial moves are what the Fed wants to accomplish. It wants to tighten the current extraordinarily loose financial conditions. Yield spreads and corporate bond yields are a big part of those financial conditions. This will happen, it always does. It's just a question of how fast and how disruptive the adjustment will be, how many junk-rated companies find themselves unable to raise funds to service their debts and keep going, and whether it will be just a painful sell-off or junk-bond mayhem.

The QE Unwind is now in full swing, with a sense of urgency. No more dilly-dallying around.

S&P, Nikkei Futures Crash After Hours As VIX Volumes Hit All Time High

Here is the simple summary of what happened today courtesy of Morgan Stanley's quants: market liquidity collapsed while VIX futs volumes hit an all time high, as countless vol-sellers were forced to cover.

The details from Morgan Stanley's quant team:


  • Liquidity in the top of the S&P futures book 50% worse than Friday.
  • Avg available size is 111 contracts since 3PM today on the top of the S&P book. Friday avg. size was 209 (for the entire day
  • Beginning  of Jan this was 800.  End of Jan it was 300.
  • VIX futures traded 897k total across the curve so far today.   Previous FULL DAY record was 850k  (aug 10 2017)
For those wondering, the market on close imbalance was a whoppoing $3.4 billion.
What does this mean in practical terms: as shown in the chart below, the crash is continuing after the close.
S&P Futures (and Dow Futures) plunged back below the key 100-day moving average after the cash-close.

Meanwhile, don't wake up Mrs. Watanabe, she is due for a shock when she learns that Nikkei futures are now down -8% and crashing lower.

The Market Is Crashing: Is the Bogeyman Risk Parity or CTAs?

In our family, it was Bau Bau who was going to "get you" if you weren't well behaved. Whether it was the boogeyman, or some other fear that kept you awake at nights, it is time to consider what the next 'pain trade' might be. While the focus has been on Risk Parity or Risk Parity Lite (my personal favorite), what is the next big strategy at risk? Could it be Commodity Trading Advisors (or CTAs)?


Salient Risk Parity Index versus Soc Gen CTA Trend Index Since July 2017


These two asset classes were moving somewhat in lock-step for much of the second half of 2017. They started to separate a little bit in December and accelerated at the start of this year.

Simplest Explanation of the Chart?

The simplest explanation is that both were long stocks but one was long bonds and the other was short bonds (if you are looking for who holds all those short future future position shorts in bonds – probably think CTA). 

Commodity positioning probably had something to do with the performance as well, but I would argue that CTAs are very long equities and very short bonds – and have benefitted from that.

Simplest Explanation CTAs

At the risk of annoying the CTAs on my distribution list, I don't think we lose too much by simplifying CTAs to 
Largely systemic, or model driven 
Largely trend following, or momentum 

Which Strategy Is More at Risk of Position Changing?

I think CTAs might be more at risk of having to stop out. On the Risk Parity side, I am not seeing evidence of outflows, if anything I am hearing some anecdotal evidence that the strategy is more interesting here – instead of your 'hedge' paying 2.4% it is paying 2.85% (depending where on the treasury curve you put on the hedges).

CTAs are always at risk of changing position – they are systematic, and momentum driven and by their nature constantly 'looking' for reasons to change position or direction (they tend to be remorseless when they do – though remorseless confers human emotions to what would be an algo driven policy).

CTAs are exposed to bonds doing ok and stocks doing poorly (which is my current view of the world). 

With 10-year yields breaking my 2.8% initial target (I still think 3% could be in play) much of the move to higher yields may be over, which would not be good for CTA positioning.

Any classic 'risk-off' move would be problematic, and while we haven't seen a true 'risk-off' move, we did see the flight to safety trade directed to the 2-year treasury on Friday.

I for one am leaning towards the real boogeyman being CTAs.

* * *

Where Have All the Vol Sellers Gone?

If anything, while seeing which strategy might be most at risk, I am waiting to see sustained selling pressure on VIX. Vix has sold off this morning from overnight highs, but I think is far from signaling the all-clear sign, especially after the recent surge in buying.

The real clue to exposing the boogeyman might be seeing what triggers real fear in the volatility markets. On Friday we saw some signs, but it seems like today, retail is coming back to sell VIX (I will admit that I too am hoping to time a nice short volatility trade in my personal account) although that has since reversed sharply with the VIX surging above 24...

"Recipe For Disaster": Traders Have Never Been Longer Stocks And Shorter Treasuries

Something strange is going on in the market according to DB's cross-asset desk, and it could be a recipe for disaster if current trends do not change.

First, recall from last week that even as Goldman's clients are getting more worried that today's market increasingly resembles that of 1987, they have extended their net long equity exposure to previously unseen levels, and as of February 1, equity futures positions were at record highs...


... which is understandable when one considers that trader sentiment as calculated by Goldman's proprietary model remains at 100, or the highest possible level, coupled with what until recently seemed unstoppable upward momentum.


Yet where things get troubling, is when looking at the bond (and interest rate) side of things, where as Deutsche Bank shows, positioning is likewise stretched to unprecedented levels.

First, consider that total net specs across the entire rate space, including Eurodollar and Treasury futures are back to all time lows (i.e. shorts).


However, where the trader short bias is especially pronounced, is at both the short-end, i.e. the 2Y treasury, where net specs just hit a new record net short, as well as the other end, or the Ultra-Long futures, where net specs also just hit an all time low (i.e. short) position.


To be sure, the sharp spike in net shorts on the, well, short-end is something we cautioned two weeks ago, when we discussed that according to Bank of America, "Momentum Traders Wreak Havoc For 2Y Treasurys, Could Unleash Sharp Bond Liquidation."

Since then, the combination of pro-inflationary economic data, coupled with the ever greater pile-on of CTAs and other momentum traders adding to their short exposure at the 2Y spot of the curve, has ignited a broad treasury selloff not only across the entire US curve, but in Asia (where the BOJ was forced to intervene twice last week to prevent a yield spike), as well as Europe, where Bund yields spike to levels last seen during the 2015 Tantrum.

The obvious problem as anyone who observed last week's market action, is that the selloff in Treasurys was finally noticed by equities, prompting a slew of post-hoc articles by Bloomberg this weekend, such as this one...

For almost a decade, investors have waited patiently for any hint of inflation in the U.S. economy, a sign the recovery can sustain itself without emergency stimulus from the Federal Reserve. Now they're getting it, and many are shocked at the reaction.

... trying to predict what trader reaction will be to the biggest weekly selloff since January 2016:

Accounts of how concerned investors should be ran the gamut, from confidence traders will rush in and buy the dip, to warnings this time is different -- that selloffs that begin in the bond market have a habit of snowballing.

The best part were the trader quotes, such as this one:

"It is now signaling, potentially, the end of this eight-year bull rally," said Rich Weiss of American Century Investments. "The Fed is going to have to move the interest rates, the bond market is recognizing that this incremental economic growth will spur on inflation from various sources."

And this:

"It's kind of a strange time and we seem to be driven by a fear of what everyone wants, and that's higher rates," said Joe "JJ" Kinahan, the chief market strategist at TD Ameritrade. "Higher rates confirm a stronger economy, and the market was very afraid of that all week long. And that's been a big reason for selling."

And, of course, the "bag of donuts" bet:

"'I'll bet you a bag of donuts that by Wednesday or Thursday of next week the equity market starts finding its footing against the backdrop of more stable bond yields," Purves said. "And then, like any bottoming process, the market tests it and tests it again and then all of a sudden, boom, new buyers come in."

But while everyone may have an opinion on what happens next, the reality is that nobody really knows with record positioning in both long equities and short treasuries which one snaps first as one of the two sides of this trade is about to be hurt, badly, once the squeeze begins.

However, one thing that is very likely is that risk-parity funds - those who benefit as long as both stocks and bond yields act in tandem - are set to suffer the biggest hit.

As we pointed out yesterday, Friday's equity market collapse and simultaneous bond market bloodbath was the biggest combined loss since December 2015, but perhaps more ominously, the week's combined loss in bonds and stocks was the worst since Feb 2009.


And judjing by the major correlation regime shift between stocks and bonds that started on Monday, this is something considerably more worrisome for investors...


... and especially risk-parity traders, who already saw their worst weekly performance since the Taper Tantrum...


... and will be forced to significantly delever in the coming days - to the tune of tens of billions in net exposure - if the vol surge persists.

What the above means is that, with all due respect to JPM's head quant Marko Kolanovic who explicitly stated that he is not concerned about a quant puke as "the move was not large enough to trigger broad deleveraging" and "equity price momentum is positive and trend followers are not likely to reduce equity exposure", we disagree... and it's not just us, so does another prominent JPMorgan analyst, Nikolaos Panigirtzoglou, who voiced the same skepticism. This is what he wrote in his latest Flows and Liquidity letter:

The bond-equity correlation, which has been predominantly negative since the Lehman crisis, has been creeping up YTD towards positive territory. In turn, this raises concerns about de-risking by multi-asset investors who depend on this correlation staying in negative territory such as risk parity funds and balanced mutual funds

Visually, the regime change is shown in the chart below:


... and also through the lens of Deutsche Bank, which warned that cross-asset correlation has suddenly surged to pre-crash levels.


Panigirtzoglou then explicitly warns under what conditions the risk parity derisking could spread to the broader market:

If these equity ETF flows which we believe are largely driven by retail investors start reversing, not only will the equity market retrench, but the resultant rise in bond-equity correlation would likely induce derisking by risk parity funds and balanced mutual funds, magnifying the eventual equity market sell-off.

Finally, note that his analysis does not include the threat of the record net equity longs and net treasury shorts, which was a profitable trade during the negative bond-stock correlation regime, but is a "recipe for disaster" as the correlation, which until recently was deeply negative, turns positive forcing one of the two sides to violently unwind.

"This Is 1987": Some "Haunting Math" On GDP Number From David Rosenberg

When discussing US unexpectedly weak Q4 GDP print, which came in at 2.6%, far below consensus and whisper estimates in the 3%+ range, and certainly both the Atlanta and NY Fed estimates, we pointed out the silver lining: personal spending and final sales, which surged 4.6% Q/Q (vs 2.2% in Q3), although even this number had a major caveat: "much of it was the result of a surge in credit card-funded spending while the personal savings rate dropped to levels last seen during the financial crisis."

Indeed, recall the stunning Gluskin Sheff chart which showed that 13-week annualized credit card balances in the U.S. had gone "completely vertical" in the last few months of 2017 which we said "should make for some great Christmas."


Meanwhile, even more troubling was the ongoing collapse in the US personal savings rate, which last month tumbled to the lowest level since the financial crisis as US consumers drained what little was left of their savings to splurge on holiday purchases.


And while we highlighted and qualified two trends as key contributors to the spending surge in Q4 personal spending, Gluskin Sheff's David Rosenberg - who is once again firmly in the bearish camp - did one better and quantified the impact. Not one to mince words, the former Merrill chief economist described what is going on as "The Twilight Zone Economy" for the following reason:

how many times in the past have we seen a 2.6% savings rate coincide with a 4.1% jobless rate? How about never...huge ETF flows driving equities higher, but these metrics are screaming 'late cycle'.

He then proceeded to give "some haunting math" from the GDP number: "The savings rate fell from 3.3% to 2.6%. If it had stayed the same, real PCE would have been 0.8% (annualized) instead of 3.8% and GDP would have been 0.6% instead of 2.6%."

Some haunting math from the GDP number. The savings rate fell from 3.3% to 2.6%. If it had stayed the same, real PCE would have been 0.8% (annualized) instead of 3.8% and GDP would have been 0.6% instead of 2.6%.

A Oops, or as Rosenberg put it:


Q4 GDP growth of 2.6% -- a booming stock market, massive post-hurricane repair and rebuild, a consumer credit card binge, and this is all we get??


Meanwhile, a more troubling development is that the conditions observed ahead of the Black Monday crash are becoming increasingly apparent. Here is Rosenberg's stark assessment of where we stand:

"Rising bond yields. Full employment. Fed tightening. Trade frictions. Weak dollar. Rising twin deficits, spurred by tax reform. Sound familiar? It should. This was 1987. Start rebalancing."

The Grand Crowded Trade Of Financial Speculation

Even well into 2017, variations of the "secular stagnation" thesis remained popular within the economics community. Accelerating synchronized global growth notwithstanding, there's been this enduring notion that economies are burdened by "insufficient aggregate demand." The "natural rate" (R-Star) has sunk to a historical low. Conviction in the central bank community has held firm – as years have passed - that the only remedy for this backdrop is extraordinarily low rates and aggressive "money" printing. Over-liquefied financial markets have enjoyed quite a prolonged celebration.

Going back to early CBBs, I've found it useful to caricature the analysis into two distinctly separate systems, the "Real Economy Sphere" and the "Financial Sphere." It's been my long-held view that financial and monetary policy innovations fueled momentous "Financial Sphere" inflation. This financial Bubble has created increasingly systemic maladjustment and structural impairment within both the Real Economy and Financial Spheres. I believe finance today is fundamentally unstable, though the associated acute fragility remains suppressed so long as securities prices are inflating.

[ZH: This week's sudden burst of volatility across all asset-classes highlights this Minskian fragility]

The mortgage finance Bubble period engendered major U.S. structural economic impairment. This became immediately apparent with the collapse of the Bubble. As was the case with previous burst Bubble episodes, the solution to systemic problems was only cheaper "money" in only great quantities. Moreover, it had become a global phenomenon that demanded a coordinated central bank response.

Where has all this led us? Global "Financial Sphere" inflation has been nothing short of spectacular. QE has added an astounding $14 TN to central bank balance sheets globally since the crisis. The Chinese banking system has inflated to an almost unbelievable $38 TN, surging from about $6.0 TN back in 2007. In the U.S., the value of total securities-to-GDP now easily exceeds previous Bubble peaks (1999 and 2007). And since 2008, U.S. non-financial debt has inflated from $35 TN to $49 TN. It has been referred to as a "beautiful deleveraging." It may at this time appear an exquisite monetary inflation, but it's no deleveraging. We'll see how long this beauty endures.

The end result has been way too much "money" slushing around global securities and asset markets – "hot money" of epic proportions. This has led to unprecedented price distortions across asset classes – unparalleled global Bubbles in sovereign debt, corporate Credit, equities and real estate – deeply systemic Bubbles in both (so-called) "risk free" and risk markets. And so long as securities prices are heading higher, it's all widely perceived as a virtually sublime market environment. Yet this could not be further detached from the reality of a dysfunctional "Financial Sphere" of acutely speculative markets fueling precarious Bubbles - all dependent upon unyielding aggressive monetary stimulus.

I have posited that aggressive tax cuts at this late stage of the cycle come replete with unappreciated risks. Global central bankers for far too long stuck with reckless stimulus measures. A powerful inflationary/speculative bias has enveloped asset markets globally. Meanwhile, various inflationary manifestations have taken hold in the global economy, largely masked by relatively contained consumer price aggregates. Meanwhile, global financial markets turned euphoric and speculative blow-off dynamics took hold. A confluence of developments has created extraordinary financial, market, economic, political and geopolitical uncertainties – held at bay by history's greatest Bubble.

Bloomberg: "U.S. Average Hourly Earnings Rose 2.9% Y/Y, Most Since 2009." Average hourly earnings gains have been slowly trending higher for the past several years. Wage gains have now attained decent momentum, which creates uncertainty as to how the tax cuts and associated booming markets will impact compensation gains going forward.

February 2 - Bloomberg (Rich Miller): "As Jerome Powell prepares to take over as chairman of the Federal Reserve on Feb. 5, some of his colleagues are publicly agitating for a radical rethink of the central bank's playbook for guiding monetary policy. Behind the push for reconsideration of the Fed's 2% inflation target: a fear of running out of monetary ammunition in the next recession. With interest rates near historically low levels—and likely to remain that way for the foreseeable future—these officials worry the Fed will have little leeway to aid the economy when a downturn inevitably hits. They argue that revamping the inflation objective beforehand could help counteract that. 'The most important issue on the table right now is that we need to consider the possibility of a new economic normal that forces us to reevaluate our targets,' Federal Reserve Bank of Philadelphia President Patrick Harker said in a Jan. 5 speech."

"Is the Fed's Inflation Target Kaput?", was the headline from the above Bloomberg article. There is a contingent in the FOMC that would welcome an inflation overshoot above target, believing this would place the Fed in a better position to confront the next downturn. With yields now surging, these inflation doves could be a growing bond market concern.

Interestingly, markets were said to have come under pressure Friday on hawkish headlines from neutral/dovish Dallas Fed President Robert Kaplan: "If We Wait to See Actual Inflation, We'll Be Too Late; We'll Likely Overshoot Full Employment This Year; We Central Bankers Must Be Very Vigilant; Base Case Is For 3 Rate Hikes in 2018, Could Be More."

[ZH: something changed this week]


Are Kaplan's comments to be interpreted bullish or bearish for the struggling bond market? Are bonds under pressure because of heightened concerns for future inflation - or is it instead more because of a fear of tighter monetary policy? Confused by the spike in yields back in 1994, the Fed questioned whether the bond market preferred a slow approach with rate hikes or, instead, more aggressive tightening measures that would keep a lid on inflation.

Just as a carefree Janet Yellen packs her bookcase for the Brookings Institute, the Powell Fed's job has suddenly morphed from easy to challenging. With tax cut stimulus in the pipeline and signs of a backdrop supportive to higher inflation, a growing contingent within the FOMC may view more aggressive tightening measures as necessary support for an increasingly skittish bond market. At the minimum, the backdrop might have central bankers thinking twice before coming hastily to rescue vulnerable stock markets.
...

The marketplace has begun to ponder risk again.

February 1 – Bloomberg (Sarah Ponczek and Lu Wang): "Coordinated selling in stocks and bonds is making life miserable for investors in one of the most popular asset allocation strategies: those lumped together under the rubric of 60/40 mutual funds. Counter to their owners' hope, that pain in one will be assuaged by the other, this week has seen both fixed-income and equities tumbling as concern has built about the pace of Federal Reserve interest rate increases. Funds that blend assets have borne the brunt, suffering their worst weekly performance since Feb 2009."


Stock prices have been going up for a long time – and seemingly straight up for a while now. Bonds, well, they've been in a 30-year bull market. Myriad strategies melding stocks and fixed-income have done exceptionally well. And so long as bonds rally when stocks suffer their occasional (mild and temporary) pullbacks, one could cling to the view that diversified stock/bond holdings were a low risk portfolio strategy (even at inflated prices for both). And for some time now, leveraging a portfolio of stocks and bonds has been pure genius. The above Bloomberg story ran Thursday. By Friday's close, scores of perceived low-risk strategies were probably questioning underlying premises. A day that saw heavy losses in equities, along with losses in Treasuries, corporate Credit and commodities, must have been particularly rough for leveraged "risk parity" strategies.


It's worth noting that the U.S. dollar caught a bid in Friday's "Risk Off" market dynamic. Just when the speculator Crowd was comfortably positioned for dollar weakness (in currencies, commodities and elsewhere), the trade abruptly reverses. It's my view that heightened currency market volatility and uncertainty had begun to impact the general risk-taking and liquidity backdrop. And this week we see the VIX surge to 17.31, the high since the election.

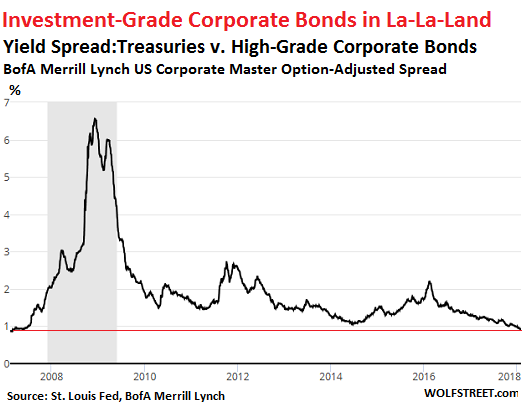
The cost of market risk protection just jumped meaningfully. Past spikes in market volatility were rather brief affairs – mere opportunities to sell volatility (derivatives/options) for fun and hefty profit. I believe markets have now entered a period of heightened volatility. To go along with currency market volatility, there's now significant bond market and policy uncertainty. The premise that Treasuries – and, only to a somewhat lesser extent, corporate Credit – will rally reliably on equity market weakness is now suspect. Indeed, faith that central bankers are right there to backstop the risk markets at the first indication of trouble may even be in some doubt with bond yields rising on inflation concerns. When push comes to shove, central bankers will foremost champion bond markets.

While attention was fixed on U.S. bond yields and equities, it's worth noting developments with another 2018 Theme:


February 2 – Wall Street Journal (Shen Hong): "Chinese stocks had their worst week since 2016, with fresh concerns about Beijing's campaign to cut financial risk and predictions of a slowing economy helping erase half of the market's year-to-date gains in just a few days… Mr. Zhang [chief executive of CYAMLAN Investment] said the increasingly frequent market intervention by the 'national team' to prop up the major indexes could prove counterproductive. 'It's OK to bring in the national team when there's a huge crisis but if it's there everyday, it will create even more jitters,' Mr. Zhang said. 'If you see policemen everywhere, don't you feel less safe?'"

The Shanghai Composite dropped 2.7% this week. Losses would have been headline-making if not for a 2.1% rally off of Friday morning lows.


The Shenzhen Exchange A index sank 6.6% this week, and China's growth stock ChiNext Index was hit 6.3%. The small cap CSI 500 index fell 5.9%, and that was despite a 2.1% rally off Friday's lows (attributed to "national team" buying). Financial stress has been quietly gaining momentum in China, with HNA and small bank liquidity issues the most prominent. As global liquidity tightens, I would expect Chinese Credit issues to be added to a suddenly lengthening list of global concerns.

Unless risk markets can quickly regain upside momentum, I expect "Risk Off" dynamics to gather force. "Risk On" melt-up dynamics were surely fueled by myriad sources of speculative leverage, including derivative strategies (i.e. in-the-money call options). As confirmed this week, euphoric speculative blow-offs are prone to abrupt reversals. Derivative players that were aggressively buying S&P futures to dynamically hedge derivative exposures one day can turn aggressive sellers just a session or two later. And in the event of an unanticipated bout of self-reinforcing de-risking/de-leveraging, it might not take long for the most abundant market liquidity backdrop imaginable to morph into an inhospitable liquidity quandary.

February 1 – Bloomberg (Sarah Ponczek): "When stocks fall, investors typically pull money out of the market. But when U.S. equities suffered their worst two-day slump since May, some traders didn't blink an eye. Exchange-traded funds took in $78.5 billion in January, exceeding the previous monthly record by nearly 30%. ETFs saw close to $4 billion a day in inflows even on the stock market's down days, according to Eric Balchunas, a Bloomberg Intelligence senior ETF analyst…"

Adding January's $79 billion ETF inflow to 2017's record $476 billion puts the 13-month total easily over half a Trillion. If the ETF Complex is hit by significant outflows, it's not clear who will take the other side of the trade. This is especially the case if the hedge funds move to hedge market risk and reduce net long exposures. And let there be no doubt, the leveraged speculators will be following ETF flows like hawks ("predators").


And I'm having difficulty clearing some earlier (Bloomberg) interview comments from my mind:

January 24 – Bloomberg (Nishant Kumar and Erik Schatzker): "Billionaire hedge-fund manager Ray Dalio said that the bond market has slipped into a bear phase and warned that a rise in yields could spark the biggest crisis for fixed-income investors in almost 40 years. 'A 1% rise in bond yields will produce the largest bear market in bonds that we have seen since 1980 to 1981,' Bridgewater Associates founder Dalio said… in Davos…"

Dalio: "'There is a lot of cash on the sidelines'. ... We're going to be inundated with cash, he said. "If you're holding cash, you're going to feel pretty stupid.'"

Here I am, as usual, plugging away late into Friday night. So, who am I to take exception to insight from a billionaire hedge fund genius. But to discuss the possibility of the worst bond bear market since 1981 - and then suggest those holding cash "are going to feel pretty stupid"? Seems to be a disconnect there somewhere. Going forward, I expect stupid cash to outperform scores of brilliant strategies.

The historic "Financial Sphere" Bubble has ensured that ungodly amounts of "money" and leverage have accumulated in The Grand Crowded Trade of Financial Speculation.

And as we detailed earlier - it doesn't get any more crowded that record long equities and record short bonds!