MARKET FLASH:

"It seems the donkey is laughing, but he instead is braying (l'asino sembra ridere ma in realtà raglia)": si veda sotto "1927-1933: Pompous Prognosticators" per avere la conferma che la storia non si ripete ma fà la rima.


lunedì 6 novembre 2017

The ‘Tax Cuts And Jobs Act’ Is Running Into Big Trouble


As debate has started on the markup in the House, reports are coming in that McCain (from the Senate) may have just killed the tax cuts. Here's the latest…

Here's a live debate of the House Ways and Means Committee on the Markup of the Tax Cuts and Jobs Act:


Reports are coming in that Senator John McCain is saying the tax plan is DOA.

From Zero Hedge:

The Republican tax reform bill is dead on arrival in the Senate now that John McCain has become the third Republican senator to confirm that he plans to vote against it.

What's worse for the Trump administration, McCain reportedly wants the bill to receive input from both parties – a criticism that he cited as his reason for voting against the Trump administration's plan to repeal and replace Obamacare. This is particularly problematic because there's approximately zero chance that any Democratic lawmakers will break ranks to vote with Republicans, despite President Donald Trump repeatedly saying that he expects to win over Democrats.

Recall that just yesterday, Vice President Pence was saying the tax cuts will indeed be undergoing changes:


Bloomberg is reporting that the next four days will be crucial for the tax plan:

The House tax-writing committee begins debate Monday on the GOP's proposed overhaul, kicking off four frantic days for lobbyists and lawmakers to revise a bill that represents President Donald Trump's final hope for a signature legislative achievement this year.

It could prove to be a make-or-break week. The head of the tax-writing panel, Kevin Brady, has signaled that he intends to allow revisions during his committee's meetings this week — but not when the bill is on the full House floor. That means other House members will have to settle for a take-it-or-leave-it vote — perhaps as soon as the week of Nov. 13.

Lobbyists and lawmakers are going to want to make their preferred changes, but "people are dreaming — it's awfully hard to get those tweaks in there," said John Feehery, a Republican lobbyist and former House leadership aide.

White House legislative affairs director Marc Short downplayed concerns a vote would be rushed through, saying in an interview Monday on Bloomberg Television that "it's not really four days" but rather several weeks, because the legislation also must clear the Senate and a conference process.

Democrats will get "every opportunity" to weigh in in the Senate, where amendments can be considered on the floor as well as in the committee progress, he said. Short acknowledged that Republicans have a "very narrow" margin for passage in the Senate but said, "We're confident we'll get it done."

Finally, SECTREAS would like to remind us to tune into Fox for the latest on just how our fearless Department of Treasury intends to MAGA:

Grab your popcorn and don't go out and blow your "tax cut" just yet. One thing is certain, and that is change…

Everybody With Paper Loses: There’s Not Enough Liquidity And The BANKS WILL CLOSE

Bill Holter explains how we are on the cusp of an unprecedented debt crisis where everybody in the paper "markets" loses. Here's why…

Bill says the paper markets are a "hologram". They are vast sums of paper wealth that is not even real, but worse yet, when the paper system comes down, everybody is going to lose. When there is not enough liquidity to cover the margin call, the person on the other side of that bet doesn't get paid, and it only cascades from there.

Bill says the low volatility over the last several months is about to change when the system freezes up. This is headed to the banks ultimately shutting down with everybody in paper assets losing the wealth that they thought they had.

Fund Manager Says The U.S. Is Melting Down Under EXTREME CORRUPTION

Trump is exposing Washington for what it is, a infested, disease ridden swamp that is almost impossible to drain. Still, 2018 is one of our last chance, we need a reset on both sides.

Reports Coming In That The Indian Government "May" Shut Down Cryptocurrency Dealers

For years this website has posted nothin' but negative article after negative article about Bitcoin. They've called it every name in the book doing their best to scare and herd their readers away. During that time Silver has fell from $49 way down to $17 range while Bitcoin went from about $200 to $7,000. Now it appears they are doubling down on their constant wrong calls that have done nothing but brought their readers anguish, hardship and some to financial ruin. You can just feel the intensity ramp up on this site everytime another watershed attach happens on the metals. However, at what point to you admit you were wrong and stop the constant negative article posts about BTC? Sure we ALL want silver to make the proverbial moon shot right along with Bitcoin but obviously that's not happening. Maybe one of these days for those that can hold tight another few years?

The last I checked the buy and sell spread was over a 1000 dollars. How could that be cheaper than a card transaction?May be there are other exchanges that are cheaper.

Is Saudi Arabia Imploding Amidst Geo-Political & Financial Pandemonium?

Gold Investor Fatigue Is What Will Lead To The Rally Of EPIC PROPORTIONS

Fatigued Isn´t the word. It's exhausting packing these rock in a airtight box .And try rowing a boat a half mile into the wind.The hardest part is throwing it overboard without capsizing the boat.To top it all off ,the mental exhaustion from trying to remember all the locations where I threw it overboard.I think I´ll get on my bicycle tomorrow and buy a couple rolls. Might take the long way around the block and let a little air out of the tires for a little extra exercise .

Adam Hamilton Makes The Case For A 9.5% Surge In The Gold Price Through February

Hamilton is a perma-bull. He has been pumping the PM stocks for many months now... as they got creamed. Do not listen to this clown...

Is Saudi Arabia Imploding Amidst Geo-Political & Financial Pandemonium?

So much has happened in Saudi Arabia in just the last three days. Here's a recap and the latest…


First, there are geo-political tensions heating up right now between Iran, Israel, Saudi Arabia and all the major nations of the war in massive war simulations:

Air-forces from nine countries with about 50 planes are now starting to drill in the most southern region of the country utilizing Uvda Air Base in Israel. Teams from India, the United States, Greece, Poland, France, Italy and Germany with be flying over 300 sorties simulating 'real war'.

Meanwhile, across the sand dunes this evening, a far more interesting story is developing, and could shed light on the end game for Blue Flag 2017. Yesterday we reported that the Saudis intercepted a ballistic missile over the nation's capital of Riyadh. Now the Saudis call the missile attack "blatant act of aggression" by Iran and "could be considered act of war". 


The smell of war is in the air and simultaneously Israel and other countries are drilling for 'real war'. As, what we've seen before – drills sometime go live.

In addition to the geo-political tensions, the financial tensions have begun. The Saudis have begun freezing assets of those arrested in the crackdown over the weekend (see below for details):

Two days after the most stunning purge in recent Saudi history, the so-called "anti-corruption probe" – which was really a countercoup – that led to the arrest of dozens of Saudi Arabian royals, ministers and businessmen allowing Mohammed to further cement control over the Kingdom, appeared to be widening on Monday when, as Reuters reports, Saudi banks begun freezing the accounts of those arrested. The Saudi central bank ordered commercial banks to freeze the accounts of people under investigation in the probe, the Reuters sources said, adding that the number of accounts affected could run into the hundreds, although the names of those affected have yet to emerge.

"The freezing of accounts has already happened," said another source. "The freezing is a precautionary measure that will end as soon as the suspects are either charged or pronounced innocent." Considering that prince Alwaleed alone has over $19 billion in assets, including nearly a billion dollars in jewelry, plans, yachts, furniture and cash…

Meanwhile, to prevent royals from quietly fleeing the country, a no-fly list has been drawn up and security forces in some Saudi airports were barring owners of private jets from taking off without a permit, pan-Arab daily Al-Asharq Al-Awsat reported.

And as the crackdown extended, so did the confusion, and many analysts were puzzled by the targeting of technocrats like ousted Economy Minister Adel Faqieh and prominent businessmen on whom the kingdom is counting to boost the private sector and wean the economy off oil.

"It seems to run so counter to the long-term goal of foreign investment and more domestic investment and a strengthened private sector," said Greg Gause, a Gulf expert at Texas A&M University. "If your goal really is anti-corruption, then you bring some cases. You don't just arrest a bunch of really high-ranking people and emphasize that the rule of law is not really what guides your actions. It just runs so counter to what he seems to have staked quite a lot of his whole plan to."

Robert Jordan, former U.S. Ambassador to Saudi Arabia, says on Bloomberg TV, said that the Saudi Crown Prince's anti-corruption drive, which included detaining Prince Alwaleed bin Talal, was "almost the equivalent of arresting Bill Gates."

"The Saudis have come to a fork in the road and they have taken it," he said adding that "this is about the most breathtaking revelation I think we could possibly have imagined."

Finally, all of these major geo-political and financial upheavals have caused the Saudi Plunge Protection Team to kick it into high gear:

As the FX markets came to life last night after a tense weekend in the middle east, it is clear that anxiety about the Saudi Riyal is at the forefront.

Forward bets on devaluation/depegging surged most in 7 months as shares in bin-Talal's Kingdom Holdings continued their slide to the lowest since Dec 2011.


The round-up risks overwhelming local and foreign investors struggling to get their heads around the rapid changes shaking the kingdom, but for the second day in a row, any selling was met by instant panic-buying as we suggest Saudi's very own Plunge Protection Team stepped in…


Here's what happened over the weekend:

First, there was a "purge" of several high ranking officials suspected of corruption:

In a shocking development, late on Saturday the Saudi press reported that prominent billionaire, member of the royal Saudi family, and one of the biggest shareholders of Citi, News Corp. and Twitter – not to mention frequent CNBC guest – Al-Waleed bin Talal, along with ten senior princes, and some 38 ministers, has been arrested for corruption and money laundering charges on orders from the new anti-corruption committee headed by Crown Prince Mohammed bin Salman, while Royal princes' private planes have been grounded.

King Salman also issued an decree forming an anti-corruption committee headed by the crown prince. Its powers include the ability to trace funds and assets, and prevent their transfer or liquidation on behalf of individuals or entities, along with the right to take any precautionary actions until cases are referred to relevant investigatory or judiciary authorities, according to a government statement.

The committee's formation was deemed necessary "due to the propensity of some people for abuse, putting their personal interest above public interest, and stealing public funds," the Royal Order said.

Then there was a helicopter crash the next day that killed 8 high ranking Saudis including a prince:

The shocking latest twist in what has been a chaotic weekend in Saudi Arabia is news that a helicopter transporting 8 high-ranking Saudi officials (including prince Mansour bin-Muqrin) has crashed in the south of the Kingdom, near the border with Yemen.


As PTI reports, a Saudi prince was killed today when a helicopter with several officials on board crashed near the kingdom's southern border with war-torn Yemen, state television said.

The news channel Al-Ekhbariya announced the death of Prince Mansour bin Muqrin, the deputy governor of Asir province and son of a former crown prince.

It did not reveal the cause of the crash or the fate of the other officials aboard the aircraft.

The crash also comes after Saudi Arabia yesterday intercepted and destroyed a ballistic missile near Riyadh's international airport after it was fired from Yemen in an escalation of the kingdom's war against Iran-backed Huthi rebels.

And Prince Aziz was also reported killed in a shoot-out during the crackdown:

Following the death of Prince Mansour bin-Muqrin in a helicopter crash near the Yemen border yesterday, the Saudi Royal Court has confirmed the death of Prince Abdul Aziz bin Fahd – killed during a firefight as authorities attempted to arrest him.


The death has been confirmed by the Saudi royal court.

The Duran and Al-Masdar News both report that the prince died when his security contingent got into a firefight with regime gunmen attempting to make an arrest.

As Al Jazeera notes, in this Saudi version of 'Game of Thrones', the 32-year-old Bin Salman shows that he is willing to throw the entire region into jeopardy to wear the royal gown.

His actions have already all but destroyed the Gulf Cooperation Council (GCC); Yemen can no longer be referred to as a functioning state; Egypt is a ticking time bomb; and now Lebanon may erupt.

There's a lot to worry about.

This Is The Broadest Episode Of Extreme Equity Market Overvaluation In History"


Market valuations, on these measures, presently approach or exceed the 1929 and 2000 extremes, placing U.S. equity market valuations at the most offensive levels in history. 

Indeed, with median valuations on these measures now more than 2.7 times their historical norms, there is strong reason to expect a market loss on the order of -63% over the completion of the current market cycle; a decline that would not even bring valuations below their historical norms (which we've typically seen by the completion of nearly every market cycle outside of the 2002 low).

"...unlike the 2000 valuation extreme, which was largely focused on a subset of extremely overvalued technology stocks, the current market extreme is the broadest episode of extreme equity market overvaluation in history. The chart below shows the median price/revenue ratio of S&P 500 component stocks, which set yet another record high in the week ended November 3, 2017, and now stands more than 50% above the 2000 extreme."

The following chart below shows our Margin-Adjusted CAPE as of November 3, 2017.

On this measure, market valuations are now more extreme than at any point in history, including the 1929 and 2000 market highs.

Finally Hussm. reminds the complacent majority of how this well end:

The final chart is a reminder of how these speculative episodes end.

In 2000, most deciles experienced losses on the order of 30-50%, with the exception of the hypervalued top decile represented, at the time, by technology stocks.

In March 2000, was written: "Over time, price/revenue ratios come back in line. Currently, that would require an 83% plunge in tech stocks (recall the 1969-70 tech massacre). If you understand values and market history, you know we're not joking."

While it feels like it at the moment, trees can't grow to the sky, but as Hussm. concludes, it's clear from market internals that investors again have the speculative bit in their teeth. 

What's important, however, is to distinguish near-term speculative outcomes from longer-term investment outcomes.

If history is any guide, the first leg down from the current speculative blowoff is likely to be abrupt and rather vertical. Investors will be tempted to buy into that decline, and may very well be rewarded for it over the shorter-run. The problem is that while investors are reluctant to sell into strength here, they may also have no tolerance for selling into a market loss once internals break down. Instead, they will likely pass up their opportunity to reduce exposure to market losses even after market internals deteriorate clearly.

After that, the intermittent hope from fast, furious (but ultimately failing) rallies will likely encourage them to hold on all the way into a deep market collapse. That's how severe market declines unfold.

It's A Huge Story": China Launching "Petroyuan" In Two months


As a reminder, nothing lasts forever...


The World Bank's former chief economist wants to replace the US dollar with a single global super-currency, saying it will create a more stable global financial system.


"The dominance of the greenback is the root cause of global financial and economic crises," Justin Yifu Lin told Bruegel, a Brussels-based policy-research think tank.


"The solution to this is to replace the national currency with a global currency."


The writing is on the wall for dollar hegemony. As Russian President Vladimir Putin said almost two months ago during the BRICs summit in Xiamen,


"Russia shares the BRICS countries' concerns over the unfairness of the global financial and economic architecture, which does not give due regard to the growing weight of the emerging economies. We are ready to work together with our partners to promote international financial regulation reforms and to overcome the excessive domination of the limited number of reserve currencies."

As P. Escobar recently noted 'to overcome the excessive domination of the limited number of reserve currencies' is the politest way of stating what the BRICS have been discussing for years now; how to bypass the US dollar, as well as the petrodollar.

Beijing is ready to step up the game. Soon China will launch a crude oil futures contract priced in yuan. This means that Russia – as well as Iran, the other key node of Eurasia integration – may bypass US sanctions by trading energy in their own currencies, or in yuan. Inbuilt in the move is a true Chinese win-win; the yuan - according to some - will be fully convertible into gold on both the Shanghai and Hong Kong exchanges.


The new triad of oil, yuan and gold is actually a win-win-win. No problem at all if energy providers prefer to be paid in physical gold instead of yuan. The key message is the US dollar being bypassed.

China's plans for oil futures trading go back more than two decades, with the government introducing a domestic crude contract in 1993 and stopping a year later amid an overhaul of its energy industry. But in 2013, the birthday of petroyuan was already looming.


In doing so China is effectively lobbing the first shot across the bow of the Petrodollar system, and more importantly, the key support of the USD in the international arena... setting the scene for the petroyuan.


And now, we are within two months of it becoming a reality as China prepares to roll out a yuan-denominated oil contract within the next two months...


"Approval of the trading rules by the securities regulator marks the clearance of a major hurdle toward launch of the contract," Li Zhoulei, an analyst with Everbright Futures, said by phone.


"The latest rules raised entry threshold for investors from the draft rules, which shows the government wants to avoid volatility when it first starts trading."

Which, according to Adam Levinson, of hedge fund manager Graticule Asset Management Asia, will be a "wake up call" for investors who haven't paid attention to the plans.


A Yuan-denominated oil contract will be a "huge story" in the fourth quarter.


"The contract is a hedging tool for Chinese oil companies. We're convinced Chinese oil companies will be anchor investors in the Aramco IPO."


All of which fits with recent comments and actions from Russian and Venezuelan officials...


"Venezuela is going to implement a new system of international payments and will create a basket of currencies to free us from the dollar," Maduro said in a multi-hour address to a new legislative "superbody." He reportedly did not provide details of this new proposal.

Maduro hinted further that the South American country would look to using the yuan instead, among other currencies.


"If they pursue us with the dollar, we'll use the Russian ruble, the yuan, yen, the Indian rupee, the euro," Maduro also said.

Additionally, Levison warns Washington that besides serving as a hedging tool for Chinese companies, the contract will aid a broader Chinese government agenda of increasing the use of the yuan in trade settlement... and thus the acceleration of de-dollarization and the rise of the Petro-Yuan.


"I don't think there's any doubt we're going to see use of the renminbi in reserves go up substantially"

Levinson was even more sanguine about China's growing credit exposure. While Chinese debt-to-GDP continues to rise, we note that Chinese sovereign credit risk has collapsed to 9 year lows...


Which as Levinson notes, "All the issues in China are occurring without fully understanding the asset side of the balance sheet." He is not concerned about China credit issues in the near-term, defining the near term as the next two years, as "the capacity of the sovereign to deal with an issue, should it occur, is pretty significant and therefore important."

Which appears to the market's perspective as China is now the least risky relative to US in four years...


Finally, while he is less concerned about China's credit, Levinson warns that the lack of volatility as stocks and bonds rally is the "scariest part" of global markets...


"If I am concerned about anything it's where the level of implied volatility trades," Levinson said in an interview in Singapore on Tuesday.


"It is extremely low. If there is something to be concerned about in global markets, it's the endogenous level of where implied volatility is trading."

Small market declines could escalate quickly, Levinson said.


"You don't know when an event or an issue is going to present itself," he said.


"But when it does, the nature of the volatility construct in markets today is such that if you have a modest correction it will turn into a much more severe one in a short period of time, because of the entrenched structural short-selling of volatility."

Any increase in market turbulence could trigger dramatic selling and the biggest of those events could be a broader adoption of China's PetroYuan contract... as Levinson says "will be a huge story" in Q4.

Stock Market Crashes happen when no one’s Worried about it

Market crashes often happen not when everyone is worried about them, but when no one is worried about them.

Complacency and overconfidence are good leading indicators of an overvalued market set for a correction or worse. Prominent magazine covers are notorious for declaring a boundless bull market right at the top just before a crash or correction.

October 19 saw the thirtieth anniversary of the greatest one-day percentage stock market crash in U.S. history — a 22% fall on October 19, 1987. In today's Dow points, a 22% decline would equal a one-day drop of over 5,000 points!

I remember October 19, 1987 well. I was chief credit officer of a major government bond dealer. We didn't have the internet back then, but we did have trading screens with live quotes. I couldn't believe what I was watching at first, but by 2:00 in the afternoon we were all glued to our screens.

It was like being a passenger on a plane that was crashing, but you had no way out of the plane. Our firm was fine (bonds rallied as stocks crashed), but we were concerned about counterparties going bankrupt and not being able to pay us on our winning bets in bonds.

What's troubling is that a lot of commentators said that the kind of crash that took place in 1987 couldn't happen today and that markets were much safer. It's true that circuit breakers and market closures could temporarily halt a slide better than we did in 1987. But those devices buy time, they don't solve the underlying fear and panic that causes market crashes.

In any case, when I hear market pros say "It can't happen again" it sounds to me like another market crash is just around the corner.

The problem with a market meltdown in today's even more deeply interconnected markets, is that once it strikes, it's difficult to contain. It can spread rapidly. Likewise, there's no guarantee that a stock market meltdown will be contained to stocks.

Panic can quickly spread to bonds, emerging markets, and currencies in a general liquidity crisis as happened in 2008.

Why should investors be so concerned right now?

For almost a year, one of the most profitable trading strategies has been to sell volatility. That's about to change…

Since the election of Donald Trump stocks have been a one-way bet. They almost always go up, and have hit record highs day after day. The strategy of selling volatility has been so profitable that promoters tout it to investors as a source of "steady, low-risk income."

Nothing could be further from the truth.

Yes, sellers of volatility have made steady profits the past year. But the strategy is extremely risky and you could lose all of your profits in a single bad day.

Think of this strategy as betting your life's savings on red at a roulette table. If the wheel comes up red, you double your money. But if you keep playing eventually the wheel will come up black and you'll lose everything.

That's what it's like to sell volatility. It feels good for a while, but eventually a black swan appears like the black number on the roulette wheel, and the sellers get wiped out. I focus on the shocks and unexpected events that others don't see.

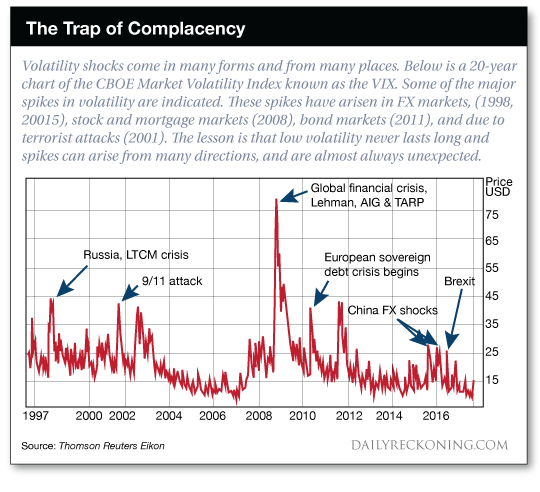
The chart below shows a 20-year history of volatility spikes. You can observe long periods of relatively low volatility such as 2004 to 2007, and 2013 to mid-2015, but these are inevitably followed by volatility super-spikes.

During these super-spikes the sellers of volatility are crushed, sometimes to the point of bankruptcy because they can't cover their bets.

The period from mid-2015 to late 2016 saw some brief volatility spikes associated with the Chinese devaluation (August and December 2015), Brexit (June 23, 2016) and the election of Donald Trump (Nov. 8, 2016). But, none of these spikes reached the super-spike levels of 2008 – 2012.

In short, we have been on a volatility holiday. Volatility is historically low and has remained so for an unusually long period of time. The sellers of volatility have been collecting "steady income," yet this is really just a winning streak at the volatility casino.

I expect the wheel of fortune to turn and for luck to run out for the sellers.


The Trap of Complacency

Here are the key volatility drivers we should be most concerned about:

The North Korean nuclear crisis is simply not going away. In fact, it seems to be getting worse. Intelligence indicates that North Korea successfully tested a hydrogen bomb in September. This is a major development.

An atomic weapon has to hit the target to destroy it. A hydrogen bomb just has to come close. This means than North Korea can pose an existential threat to U.S. cities even if its missile guidance systems are not quite perfected. Close is good enough.

A hydrogen bomb also gives North Korea the ability to unleash an electromagnetic pulse (EMP). In this scenario, the hydrogen bomb does not even strike the earth; it is detonated near the edge of space. The resulting electromagnetic wave from the release of energy could knock out the entire U.S. power grid.

Trump will not allow that to happen, and you can expect a U.S. attack, maybe early next year.

Another ticking time bomb for a volatility spike is Washington, DC dysfunction, and the potential for a government shutdown in December…

Analysts who warn about government shutdowns are often viewed as the boy who cried wolf. We've had a few government shutdowns in recent years, most recently in 2013, and two in the 1990s.

These were considered true government shutdowns in the sense that Congress did not authorize spending for any agency, and all "non-essential" government employees were put on furlough. (Critical functions such as military, TSA, postal service and air traffic control continue regardless of any shutdown).

These shutdowns don't last long. They are usually for one political party or the other to make its point about spending priorities, and are soon compromised in the form of higher spending and a return to business as usual.

Government shutdowns because of lack of spending authority are different from government shutdowns due to lack of borrowing authority and the Treasury's inability to pay its bills, or hitting the so-called "debt ceiling."

We had a debt ceiling shutdown in 2011. Those are far more dangerous to markets because they call into question the Treasury's ability to pay the national debt. We've had two near shutdowns this year; one in March, and again at the end of September. Both times Congress passed a last minute "continuing resolution" or CR that keeps government funding at current levels and keeps the doors open until a final budget can be worked out.

The current CR expires on December 8.

This time the odds are high that the government actually will shut down. Why should investors be any more concerned about this shutdown than the one in 2013 or the near misses earlier this year?

There are several causes for concern.

The first is that there is less room for compromise. The White House wants funding for the Wall with Mexico. Many Republican members of Congress want to defund Planned Parenthood. The Democrats will not vote for the Wall or to defund Planned Parenthood, but do want more funding for Obamacare.

There is no middle ground on any of these issues so the chance of a long shutdown is quite high.

The second reason is that this shutdown comes at a time when the U.S. in facing an increased risk of war with North Korea, and Congress has many other tasks on its plate including tax reform, confirmation of a new Fed Chairman, the "Dreamers" legislation, and more. Political dysfunction in Washington can easily spill over into markets.

This time the wolf may be real.

In short, the catalysts for a volatility spike are all in place. We could even get a record super-spike in volatility if several of these catalysts converge.

The "risk on / risk off" dynamic that has dominated most markets since 2013 is coming to an end. From now on it may just be "risk off" without much relief. The illusion of low volatility, ample liquidity, and ever rising stock prices is over.

It has been nine years since the last financial panic so a new one tomorrow should come as no surprise.

The safe havens will be the euro, cash, gold and low-debt emerging markets such as Russia. The areas to avoid are U.S. stocks, China, South Korea and heavily indebted emerging markets.

It may not look like it now, but it could be a volatile and bumpy ride ahead.

The Two Most Important Charts For Investing Over the Next 12 Months

Something truly massive happened in early 2017.

That "something" was the market shifted from deflation towards an inflationary outlook.

If you don't believe me, you can see for yourself.

Inflation expectations broke out of a multi-year downtrend. Not only that, but  they have since continued higher, bouncing of support.

GPC11617.jpg

Investing in the markets is like playing poker, and this was a massive "tell" that the market had changed.

The next big "tell" came when yields on the 10-Year Treasury broke out of a downtrend.

As I've explained time and again, bonds trade based on inflation expectations among other things. So to see yields rising like this, breaking a multi-year downtrend, "tells" us that the bond market is adjusting to the future threat of inflation.

GPC116172.png

Put simply, we are getting numerous signs that the markets are shifting into a new major trend. And when I saw "major" I mean MAJOR.

Markets’ Technical Analysis

Current Position Of The Market

SPX: Long-term trend – The bull market is continuing with no sign of a major top in sight.

Intermediate-trend – Soon coming to an end.

Analysis of the short-term trend is done on a daily basis with the help of hourly charts. It is an important adjunct to the analysis of daily and weekly charts which discusses the course of longer market trends.

Still Bullish (Near-Term)!

Market Overview 

Chart Analysis (These charts and subsequent ones courtesy of QCharts)

This is some bull market, huh? And it does not look like it will give up the ghost anytime soon! The probable cause of this strength will be discussed later, but for now, there are good reasons to think that it is approaching a significant correction; so this is the time for the bulls to exercise some caution as the upside potential appears to be limited. However, oweverHowever it won't happen next week. For now, it looks as if we need to go a little higher before we make another short-term top. And the next correction may not be 'it', either.

The weekly indicators are still too strong for anything really serious to take place right away. The weekly chart of the SPX shows no sign of long-term deceleration and, for that matter, nor does the daily. The 1X Point & Figure chart is showing some congestion, but we need to see more on the 10X in order to ensure a decline of consequence. This could happen over the next two or three weeks since we are nearing a short-term top which should be followed by a short-term correction and by another rally -- a process that could add enough Xs and 0s to the 10X chart to form a top capable of producing a decline of a hundred-plus points.

SPX Daily chart:

The 1810 low of January 2016 was most likely caused by the 7-year cycle which also bottomed in March 2009. But its effect on the market could not have provided a bigger contrast. Obviously a larger cycle (perhaps 40-yr) was also involved which produced the kind of weakness that we saw in the last bear market. This is the only factor that could be the cause of the strength that we now see in the market. This is why we should not expect a major top to come anytime soon. Also, if the 7-year cycle did make its low two years ago, we should not expect an important top to occur for at least another year or even more. With the 7-year cycle still in its adolescence, we can also understand why the 40-week cycle which made its low in August had such a small impact on prices, and why it is still pushing us higher and higher. It, too, is still early in its phase

The chart, below, is not showing much deceleration. Nowhere is this more evident than on the top oscillator (CCI) which has been a solid green ever since the cycle turned up. Before we can have a good correction, it will have to drop into the red. But it's very high and, although it is showing some negative divergence, it does not look not as if it is not ready to do so right away. The original price trend line was very steep and was broken only briefly, readjusting to another one also steep.

There is a minor cycle due to make its low early next week which could bring a pull-back of a few points followed by a new high. After that, there is a six-week cycle due to bottom towards the end of the month. Probably not until after its reversal should we expect to get a larger top. There are some important cycles due in the middle of January which should give us a correction on a par with that of the 40-week cycle and by that time, we will have accumulated enough distribution on the 10X chart to nurture a significant downtrend.


SPX Hourly Chart:

On Friday, SPX nearly matched the previous high -- only coming a few pennies short. Since there is a 10-day cycle low due on Tuesday, it's likely that we will pull-back for a couple of days before making a slightly newer high. The pattern we are making looks very much like an ending diagonal which would be complete on the next small up-move. If it is an ending diagonal, the next short-term correction could take us back to the point from which it originated, around 2545. After the next rally we should finally be ready for a more important pause in this uptrend which could bring about a correction of a hundred points or more. A more accurate count will be available after we have made our final top and take a measurement of the distribution pattern.

Toward the end of the day on Friday, it looked very much as if we were preparing to reverse into the minor cycle low. In spite of a 12-point rally, the A/Ds started the day negative and remained negative throughout the entire treading session.. The move in the SPX was largely the result of a strong tech sector. It peaked a couple of hours before the close and underwent a little distribution until the closing bell.


An Overview Of Some Important Indexes (Daily Charts)

The lower tier – except for QQQ – is suggesting that a correction is coming. QQQ responded to the recent strength in the tech sector which led the market higher last week. We may be starting to differentiate between the leaders and the followers.


UUP (Dollar ETF)

UUP has completely come out of its corrective channel and, after a brief consolidation, is getting ready to move past its last downtrend line. The break-out wave looks valid and the index should move higher. A move up to its 233-day MA would represent a 50% retracement of its recent decline and looks like an attainable goal for now.


GDX (ETF For Gold)

GDX moved down to its ideal time frame for the low of the 6-wk cycle and turned up on Friday. If it continues higher, this will be confirmed as a genuine reversal and we should see higher prices before it is pulled back down by the next bottoming 9-10 week cycle.


USO (United States Oil Fund)

USO has made an impressive recovery since its June low. However, it is coming up to the top trend line of its primary corrective channel and, even if it goes through it, it will face more resistance from its previous short-term highs. If this is a genuine trend reversal, more consolidation should be expected before it can overcome the 12.50 high.


Summary

SPX is three to four weeks away from an intermediate top. A few minor reversals to build an adequate distribution phase on the P&F chart will first be required.

AT THE JUNCTION OF RISK ‘ON’ AND RISK ‘OFF’

At the junction of the inflated risk 'on' trade (stocks, global growth assets, etc.) and risk 'off' (gold, Treasury bonds, cash & equivalents, etc.) are the pivotal indicators to these conditions, Treasury bond yields, yield dynamics and bond market signals.

My assumptions are that inflation instigated speculation is in play, but it has been seen as 'good' inflation or not inflation at all because it's been rooted in stocks on this cycle… and how can that be bad? That is sarcasm.

The other assumption is that the bond market, routinely manipulated at will by powerful policy makers over the last 9 years has served two purposes; to mask the inflation (the Fed's Operation Twist literally had that as its primary goal and function) and to help fund asset speculation. I just shake my head when I hear economists talking about 'GDP this, full capacity that and recession the other thing' in conventional, buttoned down terms because the economic recovery is the asset bubble and after this one is resolved they'll be doing what they always do, which is feed us all the reasons why it went down an unexpected path well after the fact. That is because it is not a conventional economist's job to question why, only to extrapolate conventional Economics 101 through Masters degree level economic theory… until something breaks.

Look no further than economic guru Abbie Joseph Cohen, she of 2000 bubble era fame. Apparently she's still taken seriously as there she was being interviewed on NPR this week. In a discussion about new Fed chairman Jay Powell (a non-economist she made sure to point out and fret about) Abbs talked about how Masters level economist Ben Bernanke was masterful in his deft handling of the 2008 "financial crisis". People with vested interests in keeping you in conventional thinking mode never seem to mention that it was Federal Reserve policy excess that instigated the "financial crisis" in the first place. Take a view from Wonderlandand you may see the folly of it all.

Back on message, the assumptions are that money printing in its various forms was used to promote asset speculation as an economic remedy and that bonds have been manipulated in order not to show true inflationary signals. If you ask me, these assumptions are self-evident, but for the sake of balance we'll play it straight. We'll also note again that stock market trends are bullish (Captain Obvious). That is what most people actually care about, I grant you. But I have a need to always be trying to flesh out the why along with the what. The why is the result of massive monetary stimulation and the what is bullish. Period.

But where are we going? That's up to indicators, many of which are bemoaned to have been dysfunctional on this bull cycle. Yet the abused and bastardized bond market may yet provide us with the necessary signals. Right now it's a bull party and is likely to remain a bull party as long as current bond indicator trends are in place; and so let's update through the lens of bond yields and dynamics.

Using the 10 year yield we note that a bullish pattern is still in play, although bonds rallied hard this week and yields dropped. Should the pattern be reactivated after the false breakout, the target is 2.9%.

tnx

The implications? Well, for the bond market the implication is that the 2.9% daily pattern measurement fits nicely with some big picture macro points that would serve as either the death of yet another inflationary phase (the inflation is out there folks, not in the numbers the government cooks up but rather, it's rooted in stocks and leveraged risk assets) or the gateway to a full frontal von Mises style inflationary "Crack Up Boom", which would probably be perceived as bullish in its initial stages.

tnx

Maybe the simplest way of timingevents is to not try to time them at all *, but instead patiently let the indicators play out. We should know shortly if chart #1 above is going to resume its bullish yield destiny (bearish for bonds) and go hand in hand with rising risk 'on' assets and increasing inflationary noise. This would be an extension of the yield rise in 2016 that gained fuel due to the perceived fiscal reflation to come, after Trump was elected. The yield is still in a bullish looking 'handle' to that initial big up surge.

Yields can rise quite a way with bullish stock prices, and referring to the second chart, no real inflationary hysteria is indicated until the resistance traffic in the 2.9% to 3% area is exceeded; although the media may once again get hysterical about inflation below the limit area as it did when Bill Gross famously went short bonds (long yields) in 2011's 'inflation expectations' blow off and the "Great Rotation" promo that was spun in 2013. In each case, deflationary winds then blew in to varying degrees, capping yields and signaling new downturns.

Here is another monthly chart, showing various yields and the yield curve. Things 1-3 are in bull flags and as yields rise with risk 'on', all is indicated to be okay. But again, the moving averages are either the limiters to the party or they are the gatekeepers to an inflation scenario that could run too hot. Goldilocks likes her porridge "just right", after all. If the party is limited at the moving averages (30yr @ 3.3%, 10yr @ 2.9%) it would be a logical time for a correction in stocks. That has been our preferred view and that is what I am sticking with as long as the daily yield charts do not break down.

yields

If the yield charts do break down before a try for the limiters, we will need to decide whether the immediate play is a bullish Goldilocks scenario (economic signals vs. inflation signals 'just right') or a real lurch to risk 'off'. In this regard, it will be helpful to follow the signals from junk bonds vs. bonds of relative quality and inflation protected vs. unprotected Treasury bonds. Here we have a mixed view on the daily charts of these gauges of the will to speculate by casino patrons.

Last week risk inched 'off' below the market's surface as Junk vs. both Investment Grade and Treasury faded along with the fade in nominal Treasury yields. If yields find footing and the markets continue upward these ratios are expected to turn back upward. If they don't, they would be a negative divergence to the asset party.

hyg

Yet TIP/IEF (an 'inflation expectations' gauge) held the 200 day moving average and as such, remains a constructive marker for the case of a renewed rise in nominal long-term interest rates.

tip/ief

From the St. Louis Fed, the 10yr Breakeven rate is a similar gauge of inflation expectations. This longer-term view shows that not only was a downtrend broken in 2016 (blue), but a still-intact uptrend began earlier that year. The Fed wants inflation (in a "just right" amount, ha ha ha) and a test of the high or a new high in this gauge (above the Trump-fueled peak in early 2017) would give them inflation alright. As a tie-in to the first 3 charts above, a bout of inflationary expectations is probably needed to push nominal yields to their limiters.

10yr breakeven rate

Yet the Fed is on a course to slowly take back the stimulants to the currently brewing asset bubble. But the Fed's course is gradual, both in remedying its own QE-bloated balance sheet and taking back the egregious ZIRP (zero % interest rates for 7 years) policy. We are using this chart to note that the 2yr yield/Fed Funds rate (FFR) is on its way to 1, but not yet in a danger zone.

2yr fed rate

Here is the same chart showing the 2yr yield minus the Fed Funds rate. No danger yet.

2yr fed funds

For perspective, here is the big picture chart that shows what happened during the S&P 500's Humps 1&2 after the FFR had climbed to the level of 2yr yields and the 2yr yield began to negatively diverge. The 2yr is currently safely above the FFR and there is no divergence. But while managing the bullish (risk 'on') present, we should also look ahead.

spx

In line with the view in nominal Treasury yields and the 2yr vs. the FFR, the final component of our Treasury bond indicator fest is the yield curve, which is plainly in a daily downtrend.

yield curve

A down trending yield curve favors Goldilocks and the "just right" economy and inflation backdrop. But the question remains open as to where the decline will be arrested and beyond that, whether the next up turn will be inflationary or deflationary (a question that carries significant investment strategy implications, obviously).

yield curve

Bottom Line

Barring a lurch to risk 'off' right now (per 30 & 10yr yield pattern failures and the negative hint in the 'junk vs. quality' ratios) a combination of nominal yield limiters (30yr @ 3.3%, 10yr @ 2.9%), inflation expectations, Fed Funds vs. 2yr yields and the state of the yield curve will give us all the information we need to know about the macro. It was the bond market that was used to instigate the current asset bull and it is the bond market that will signal either its continuation, interruption or its end.

Right now the favored view is that the bullish backdrop remains in play and is the dominant trend (Captain Obvious). But if/when certain indications register it will be time to favor a significant correction. It is either that or an inflationary von Mises Crack Up Boom awaits. We are not going to have "just right" porridge forever. No way in hell.

* My Q4 market top (for a significant correction at least) is still hanging out there and has the better part of 2 months left to prove out or fail. But again, the theme of this article is that bond indicators will actually decide the 'when' and for that matter, the 'what'.