Economic commentaries, articles and news reflecting my personal views, present trends and trade opportunities. By F. F. F. Russo (PLEASE NO MISUNDERSTANDING: IT'S FREE).
MARKET FLASH:
lunedì 29 gennaio 2018
How Long Before The Bond Selloff Slams Stocks? Wall Street Answers
Treasury Yields Are Blowing Out, Slowing Dollar Plunge
CONTROLLED DEMOLITION OF THE MARKETS - DOLLAR, NEXT TREASURIES, THEN STOCKMARKET - GOLD, SILVER & PM STOCKS TO SOAR...
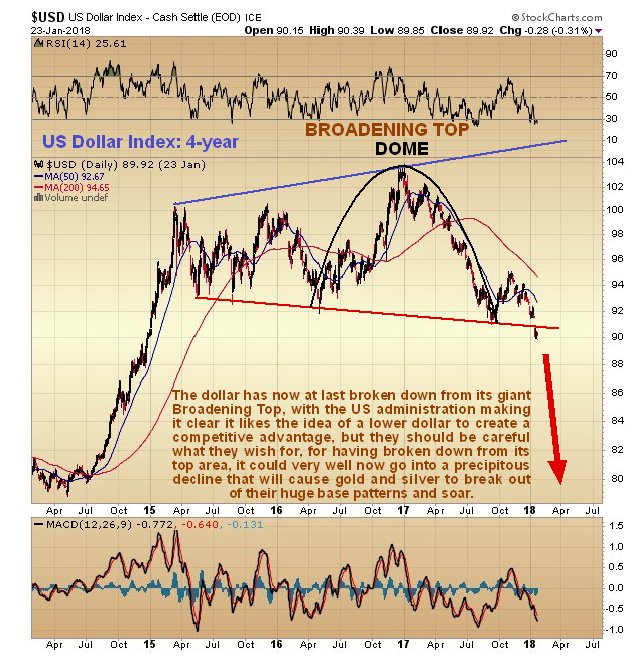
What we are about to witness in the markets will be similar to watching a gigantic controlled demolition, like say the World Trade Center controlled demolition in NYC. The initial charge that starts the whole sequence of momentous events is the dollar breakdown of recent days. This was triggered by the imposition of destructive trade tariffs by the Trump Administration who then made it plain they were happy to see the dollar drop to make US exports more competitive. Actions have consequences, and a falling dollar will make dollar denominated investments less attractive, like the Treasuries, which the US depends on to funnel the rest of the world's wealth into its coffers – the deal has always been this: the US prints up unlimited quantities of dollars and Treasuries, created electronically with a few keystrokes, and then exchanges them for goods and services from the rest of the world, with most of the inflationary consequences of this pushed off onto the rest of the world. Other countries around the world have until now gone along with this scam, because if they don't they get cut off from the SWIFT system, subjected to punitive sanctions or even invaded, or a combination of the three.
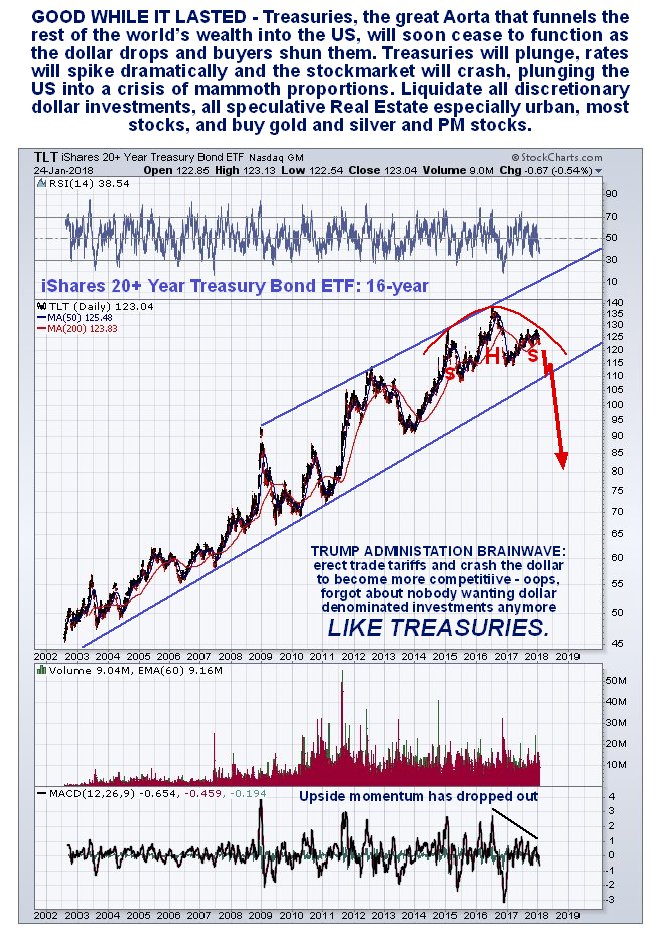
On the long-term 16-year chart for Treasury long bond proxy TLT we can see that its decades long bullmarket is showing clear signs of reversing, with upside momentum spluttering and a Head-and-Shoulders top completing. A breakdown from the large uptrend shown will usher in the first serious bearmarket in Treasuries for years that will send interest rates soaring, which will create an acute financial crisis in the debt-wracked US. With the dollar set to plummet this breakdown could happen soon.
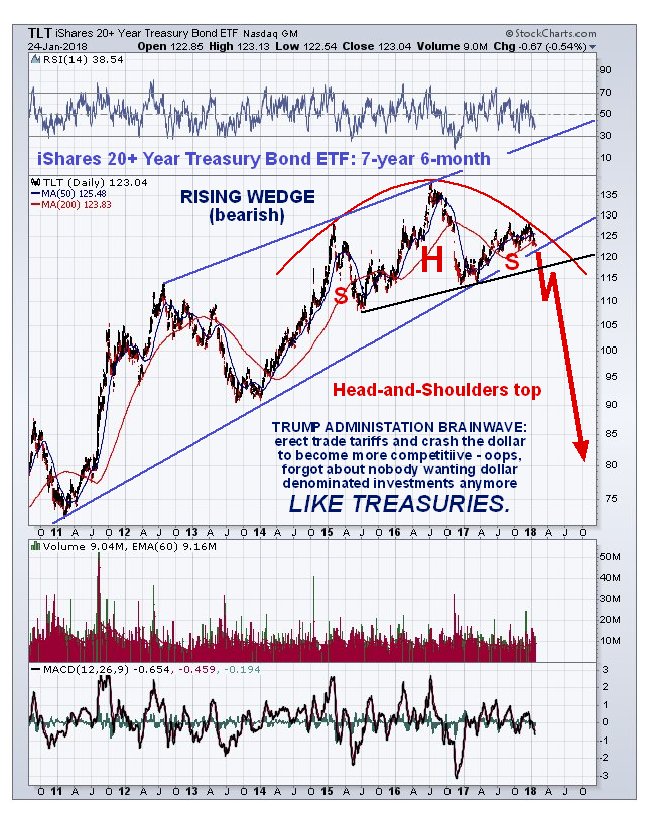
On the 7-year 6-month chart we see that, within the giant uptrend shown on the 16-year chart, a bearish Rising Wedge has formed culminating in a Head-and-Shoulders top, which it is now very close to breaking down from…
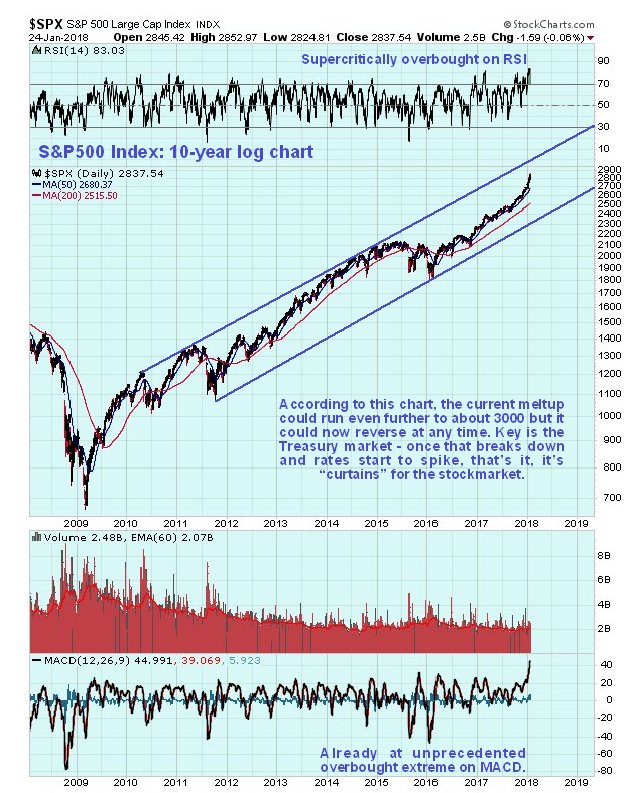
Soaring interest rates will quickly rip the rug out from under the wildly overextended US stockmarket, which will crater in a manner that will make the '29 crash look like a walk in the park. On the 10-year chart for the S&P500 index we can see that the current meltup could run even further to the upper channel boundary of the channel shown on this long chart, before investors have a very nasty reality check, although it could reverse now at any time, especially given the dollar's slide and the storm clouds gathering over the Treasury market.
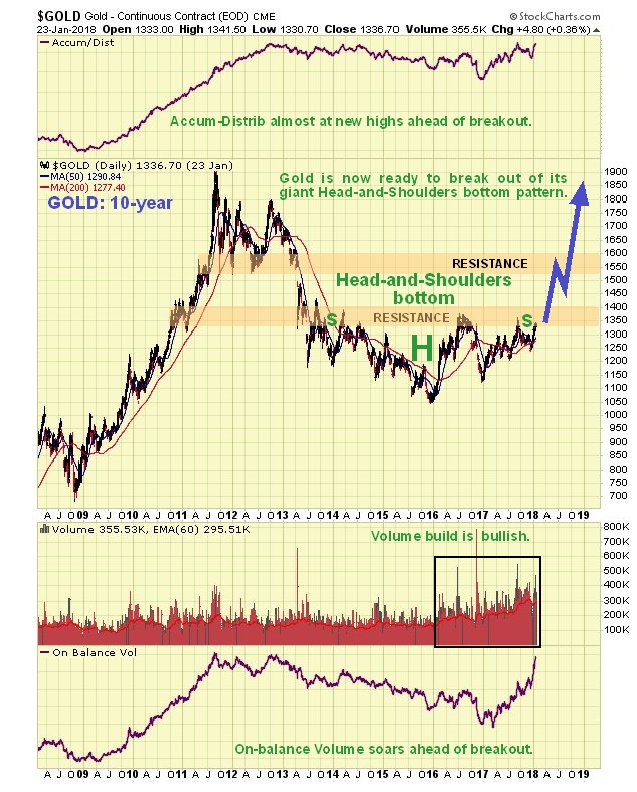
With Treasuries out of the question as a bolthole, safehaven money will gush into gold and silver, which will soar since there is already an acute shortage of physical, even before gold and silver have broken out of their large base patterns. This will bring a wry smile to the faces of Chinese bankers who have been squirreling away vast quantities of gold as fast as the stupid West would sell it to them. As for the US trying to tell China what it can or can't do in the South China Sea, it will be lucky to be able to finance a task force to sail over there, the way things are going, and if it does the Chinese have the military capability to send it to the bottom in less time than it takes to boil an egg, if they so choose.
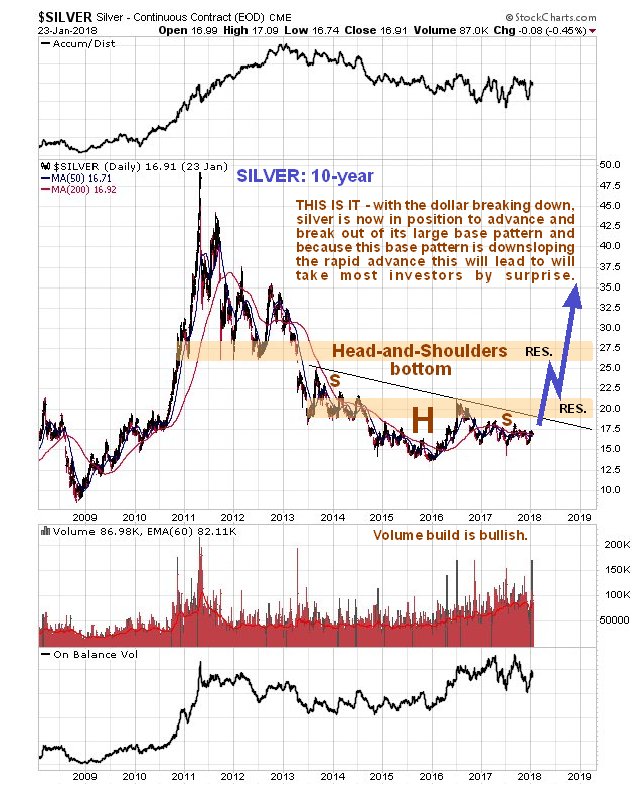
The picture for silver is very similar, except that silver's Head-and-Shoulders bottom is downsloping, because silver tends to underperform gold at the tail end of bearmarkets. Because this downslope camouflages the incubating bullmarket much more than is the case with gold, it creates the conditions for explosive upside when the bullmarket does get going, especially as silver tends to be leveraged to the price of gold. It is actually hard for many investors to comprehend the upside potential of silver stocks after the long bearmarket.
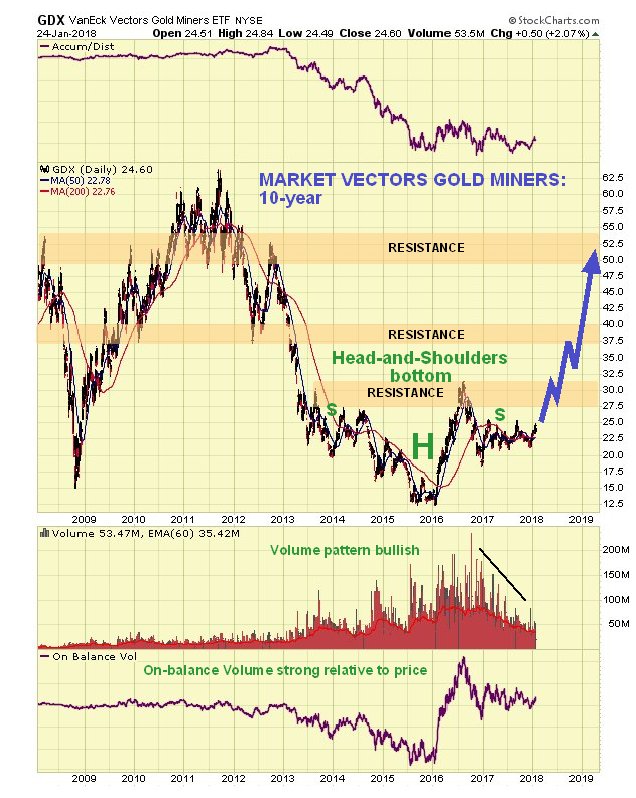
When these bullmarkets at last get going in gold and silver, the gains in many gold and silver stocks are going to be breathtaking, here's why. Taking the case of gold producers, their performance is highly geared to the price of gold, because of their hefty and at times extremely burdensome fixed costs. All-in sustaining costs (AISC) are what it takes to keep the lights on and remain (just) economically viable, it's what it costs to produce an ounce of gold. In the case of many gold producers it is about $1000 - $1200 an ounce. If the price of gold is say $1200, which is a little below the mean cost in recent years, and a gold company's AISC is $1100, then it makes just $100 profit per ounce of gold. So what happens if the price of gold rises $1000, to $2200, which is a modest level given where we are headed? That's right – the company's profits go from $100 an ounce to $1100 an ounce, a MORE THAN 10-FOLD INCREASE IN PROFITS! – you don't have to be a genius to figure out what effect this is likely to have on the stock price. We already saw an example of this leverage during the 1st half of 2016. Towards the end of 2015 gold and silver mining companies were being squeezed until the pips squeeked by extremely low metals prices, with gold dropping as low at $1050 – many were bleeding red ink and on the verge of shutting up shop, but look what happened when gold and silver prices rose sharply early in 2016 and the pressure came off – gold stock indices soared, as you can see on the 10-year chart for the GDX below, which more than doubled in the space of a few months, and you can also see that like gold and silver themselves, GDX (and other gold stock indices) is marking out a large Head-and-Shoulders bottom, and is still some way from breaking out of it so stock prices are good.
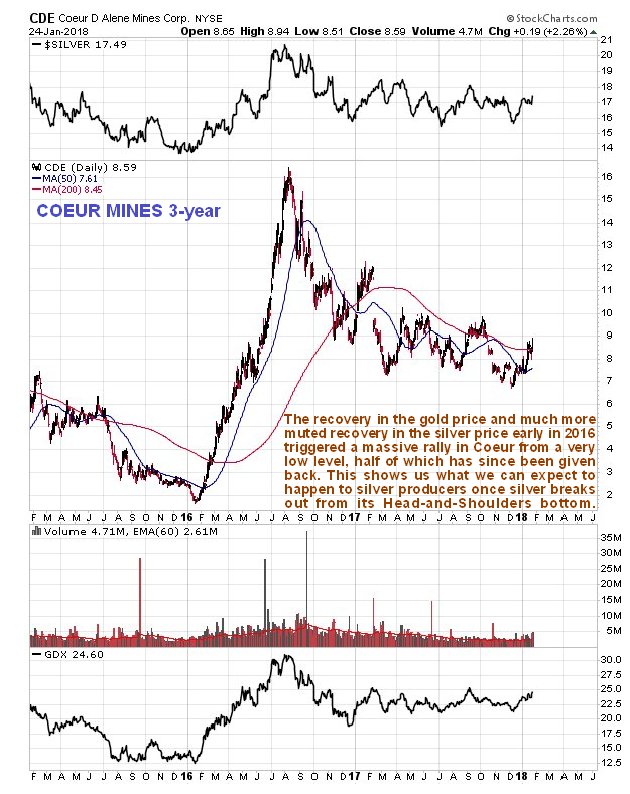
If you want to see an example of the sort of rises we can look forward to when gold and silver break out of their base patterns, we need look no further than Coeur Mines, which rose from under $2 to over $16 in the space of a about 7 months, which is a more than 8-fold increase!! Coeur has since given half of this back, but looks poised to make a similar move when silver breaks out, although in percentage terms it probably won't be so big because it will be rising from a higher level.
Seen from outside Washington has descended to the level of a circus as those who really run the country continue to discredit and lame Trump, and at the same time attempt to smear Russia – Paul Craig Roberts in The Russiagate Stakes are Extreme believes that Russiagate is an organized plot to stage a coup against the elected President of the United States, which is hardly surprising since they have never accepted that their marionette Hillary Clinton lost the election – she couldn't accept it either and wrote an awful self-indulgent book about it entitled What Happened? which you would have to be retarded to waste your time reading. Despite him bending over backwards to ingratiate himself with them by talking about "our great military" and promising them even more of the national cake than the $700 billion dollars or so they receive already, and paying homage at the Wailing Wall in Jerusalem with a skull cap on, his efforts to placate them don't seem to have been enough.
Why The U.S. Stock Market Is Overbought And Overvalued
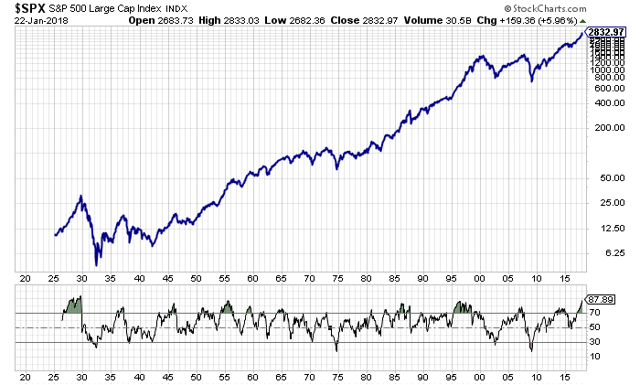
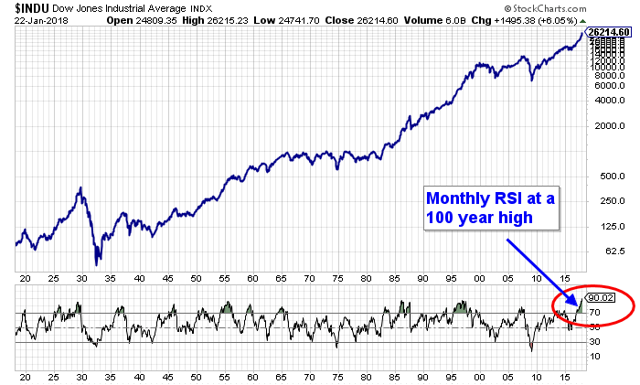
The monthly relative strength index (RSI) on the Dow Jones Industrial Average is at a record high and is at near record levels for the S&P 500.
The Coming Market Crash Will Set Off The Biggest Gold Panic Buying In History
The leverage in the economic system has become so extreme; investors have no idea of the disaster that is going to take place during the next stock market crash. The collapse of the U.S. Housing and Investment Banking Industry in 2008 and ensuing economic turmoil was a mere WARM-UP for STAGE 2 of the continued disintegration of the global financial and economic system.
While the U.S. and the global economy have seemingly continued business as usual since the Fed and Central Banks stepped in and propped up the collapsing markets in 2008, this was only a one-time GET OUT OF JAIL free card that can't be used again. What the Fed and Central Banks did to keep the system from falling off the cliff in 2008 was quite similar to a scene in a science fiction movie where the commander of the spaceship uses the last bit of rocket-fuel propulsion in just the nick of time to get them back to earth on the correct orbit.
Thus, the only way forward, according to the Central banks, was to increase the amount of money printing, leverage, asset values, and debt. While this policy can work for a while, it doesn't last forever. And unfortunately, forever is now, here….or soon to be here. So, it might be a good time to look around and see how good things are now because the future won't be pretty.
To give you an idea the amount of leverage in the markets, let's take a look at a chart posted in the article, A Market Valuation That Defies Comparison. The article was written by Michael Lebowitz of RealInvestmentAdvice.com. I like to give credit when credit is due, especially when someone puts out excellent analysis. In the article, Lebowitz stated the following:
The graph above highlights that valuations using this measure dwarf any prior valuation peak since at least the 1950's. At over 350% above the mean, stock investors are currently paying significantly more for a unit of economic growth than at any time in the last 70 years. To extend the analysis, we estimated the adjusted CAPE level of 1929, as shown on the graph, and come to the same conclusion.
Most astute investors know that stock valuations are at or near historical highs. Even these investors, however, may be unaware that today's valuations, when adjusted for the level of economic growth and heightened profit margins, defy comparison with any prior period since the Great Depression. The simple fact is that investors are paying over three times the average and almost twice as much as the prior peak for a dollar of economic growth. Furthermore, it is happening at a time when we are clearly late in the economic cycle and the outlook for growth, even if one is optimistic, is well below that required to justify such a level.
The ratio in the chart comes from companies' profit margins and the GDP (Gross Domestic Product) adjusting CAPE (cyclical average price to earnings). The important takeaway in the chart is that this ratio today (3.63) is much higher than in 1999 (1.91) or right before the 1929 Great Depression (2.68). Thus, the author is suggesting that investors are paying over three times the average for a dollar of economic growth. While this can continue a bit longer, the higher it goes, the bigger correction and return back to normal levels.
When the markets correct, I believe they will correct violently…. or most likely crash at some point. Thus, the next market crash will cause the largest panic gold buying in history.
Setting Up The Foundation For Coming Gold Panic Buying Market
To understand the staggering amount of investor gold buying during the next market crash, we need to take a look at past trends in the gold market. For example, there are three different volumes of global gold investment. Actually, there is a fourth, Central Bank gold demand, but I am going to exclude it to focus only on private investment.
First, we have total global gold coin and bar demand. As we can see in the chart below, global gold coin and bar demand increased significantly during the 2008 U.S. Housing and Investment Banking Collapse. Gold coin and bar demand nearly doubled to 875 mt (mt) in 2008 from 442 mt in 2007:

As the gold price reached a peak of nearly $1,900 in 2011, gold coin and bar demand shot up to 1,498 mt. However, as the price of gold fell by $500 in the first half of 2013, investors seeing an excellent bargain, purchased a record 1,716 mt of physical gold investment. But as the gold price continued to fall and remain weak in 2014, 2015 and 2016, gold coin and bar demand stayed flat at a little more than 1,000 mt.
Furthermore, as the stock market took off after the election of President Trump to the Whitehouse and as Bitcoin and the Cryptocurrencies experienced nosebleed percentage gains, demand for physical gold investment fell even lower in 2017.
Even though physical gold investment demand over the past four years is less than during the 2010-2013 period, it is still more than double than what it was in 2007, before STAGE 1 of the Collapse… the infamous Subprime Housing Meltdown.
Global Gold ETF Demand… The Nasty Wild Card
While many investors in the alternative media community don't believe that the Gold ETF's hold all the gold they report, I look at this market as one of the most important indicators, or better yet, the critical Wild Card. I really don't care if these Gold ETFs hold all the metal they claim. If you are a prudent precious metals investor, you will hold most (if not all) of your gold physically. However, the Gold ETFs provide us with the most important indicator in the gold market.
Why, because a large percentage of Gold ETF demand comes from retail investors. Most precious metals diehard investors only believe in purchasing real physical metal. So, when we see significant changes in the Gold ETF market, then it means the 99% of retail investors in the market are waking up. The two largest increases in Gold ETF demand (and their inventories) were during two fearful market events… Q1 2009 and Q1 2016:

Of the total 624 mt of Gold ETF demand in 2009, 465 mt of that amount took place during the first quarter when the Dow Jones Index was falling to its gut-wrenching lows of 6,600. Retail investors were in panic mode, so they were moving into Gold ETFs in a big way. Thus, 75% of total Gold ETF demand in 2009 took place during the first three months of the year.
The next highest amount of Gold ETF demand was in 545 mt in 2016. However, 350 mt or 64% of total Gold ETF demand that year also took place during the first quarter when the Dow Jones Index fell 2,000 points. Something seriously spoked retail investors to plow back into gold during that period. Moreover, as the Dow Jones was falling 2,000 points, the gold price was shooting higher by $200. So, individuals who believe gold will selloff down to $750 with the next market crash, need to REREAD the sentence above.
Okay, getting back to the Gold ETF chart. As the stock markets recovered in 2010, even as the price of gold surged to $1,900, Gold ETF demand continued to fall to a 306 mt in 2012. However, as the gold price lost $500 in 2013, retail investors sold off their Gold ETF investments in record numbers. As we can see, Gold ETF inventory liquidations were a stunning 912 mt in 2013. As retail investors were selling their Gold ETF investments, precious metals investors around the world were buying physical gold, HAND OVER FIST. It was in 2013 that global gold coin and bar demand surged to 1,716 mt.
After the initial gold price smash in 2013, Gold ETF liquidations were reduced to only 184 mt in 2014 and 125 mt in 2015. Again, it wasn't until the stock market suffered what investors thought as a worrisome correction, did Gold ETF demand returned in a big way in 2016. And as the stock and crypto markets shot up towards the moon and stars, Gold ETF demand declined considerably in 2017.
Again, I am not going to debate whether or not the Gold ETFs hold all the gold they claim. If you are smart, you own physical gold and if you want to trade profits, then using Gold ETFs for that purpose is understandable… but not to PROTECT WEALTH, only to trade for profits.
Total Gold Investment Demand Fluctuates Due To Fickle Retail Investors
If we combine gold coin and bar demand with Gold ETF demand, we have another chart. This chart represents the NET global gold investment. As we can see, total global gold demand was the highest in 2011 when the gold price shot up to $1,900 in September of the year:

After the 2008 U.S. Housing and Investment Banking collapse, and as the gold price recovered, total global gold investment increased from 695 mt in 2007 to a peak of 1,730 mt in 2011. It wasn't until 2013 when the gold price lost $500 did the massive global Gold ETF liquidations impact overall demand by cutting it in half to 803 mt versus 1,610 in 2012. And as I mentioned above, total global gold investment didn't rise until FEAR in the markets reappeared at the beginning of 2016 when retail investors flocked back to Gold ETFs.
While global gold investment is forecasted to decline in 2017 to 1,155 mt, due to investors placing their bets in the rapidly rising stock and crypto markets, I believe this is the CALM before the STORM. Unfortunately, retail investors have been lured to sleep by rising asset values that they don't realize the market is setting up for one hell of a correction-crash.
What Record Gold Investment Will Look Like When The Markets Finally Crash
By looking at previous record years of gold coin and bar investment as well as Gold ETF demand, we can estimate how much total gold investment will increase during the next market crash. For example, there was 624 mt of Gold ETF demand in 2009 and 1,716 mt of gold coin and bar investment in 2013:

If we add these two previous record years together, we end up with a total of 2,340 mt of total gold investment. Now, this figure represents what has already taken place in the gold market during both peak periods of gold investment demand. However, if we estimate the kind of demand that would take place during the next market crash, it can undoubtedly reach 3,000 mt or even 4,000 mt during a full-blown market meltdown.
Investors need to realize that the decade-long Fed and Central Bank band-aid of massive money printing and exponentially rising debt levels since the 2008 market crash has not fixed the problem, it has only made it worse. They have inflated asset values of stocks, bonds, and real estate to such high levels; a normal market correction will turn into a panic crash. The next market crash will be like nothing we have witnessed before. Thus, panicked investors will move into the safe-haven gold market in record numbers.
I believe we could easily see 1,000+ mt of global Gold ETF demand and 2,000+ mt of gold coin and bar investment during the next market meltdown. However, total global gold investment demand could approach 4,000 mt and exceed it if the Fed and Central Banks lose control of the markets. And, it's not a matter of "IF," it is a matter of "WHEN."
According to the World Gold Council, total gold demand in 2016 was 4,350 mt, with total gold investment demand of only 1,587 mt. Thus, gold investment accounted for only a little more than a third of overall gold demand last year. When global gold investment demand surges to 3,000 or even 4,000 mt, where is the supply going to come from when investors around the world realize the GIG is up?
Lastly, the critical WILDCARD in the gold market is the retail investor. The retail investor accounts for 98-99% of the market. So, when the retail investor gets spooked as FEAR starts to motivate their investing decisions, we could see insane Gold ETF demand. Unfortunately, there may not be enough physical gold to go around. Thus, Gold ETFs may not be able to access the metal to increase their inventories in relationship to rising demand.
So, it makes perfect sense that the real FIREWORKS in the gold market will take place where 99% of the market makes the decisions. While the 1-2% of precious metals investors would most certainly increase the gold and silver holdings during the next market crash, it's the retail investors that will totally overwhelm the gold market.
Keep an eye on Gold ETF demand as it will be the crazy WILDCARD.

