MARKET FLASH:

"It seems the donkey is laughing, but he instead is braying (l'asino sembra ridere ma in realtà raglia)": si veda sotto "1927-1933: Pompous Prognosticators" per avere la conferma che la storia non si ripete ma fà la rima.


venerdì 4 maggio 2018

Has Stagflation Arrived in the US?

The Fed is fast approaching its worst nightmare.

Stag-flation.

Stagflation is when inflation is rising at the same time that the economy is weakening, if not contracting.

The Fed has always argued that low levels of inflation (2%) were acceptable provided the economy was also growing. Indeed, this is the very gimmick the Fed has utilized to mask the fact that quality of life has been falling in the US since the early '70s (by understating inflation, the Fed has overstated economic/ income growth).

All of the negative effects of inflation (wealth inequality, higher costs of living, increased debt required to maintain living standards) are "masked" by the Fed's argument, "look how well the economy is doing! If we weren't running things everything would be much worse. A little inflation isn't a bad thing after all!"

Not with stagflation.

With stagflation you've got the economy shrinking, meaning people are losing their jobs and incomes are falling at the SAME time that the cost of living is exploding higher and thing are getting more expensive.


Cue yesterday's Fed FOMC statement in which the Fed REMOVED its claim that the "economy outlook has strengthened."

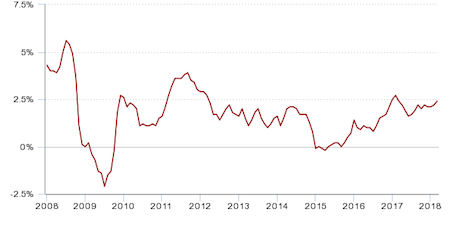
So the Fed has noticed that the economy is slowing and no longer has a great outlook. And this is happening at a time when the Fed's official inflation measure, the CPI, is clocking in at 2.36% year over year (which incidentally the Fed is trying to ignore).

Put simply: stagflation is here.

giovedì 3 maggio 2018

Charles Nenner Warns "The Whole Thing Will Come Tumbling Down"

Renowned geopolitical and financial cycle expert Charles Nenner says, "The mainstream media talking heads are telling you to buy, but never tell you to sell." Nenner says the time to sell stocks is getting close and explains,

"It's just a hopeless situation. I feel sorry for people who invest their money. We have had a nice ride, but soon the whole thing will come tumbling down.

They listen to all these things and have no clue on how to invest... I think soon... this will become the longest expansion in financial history...

So, this could be the longest expansion ever, what are you playing with? You are gambling with nonsense. So, it's over."

Nenner goes on to say, "Then, you have the inflation story. The inflation story is brought about by people who don't do their historical homework. "

"They remember for the last 30 years, there was always inflation. So, they continue to talk about inflation. I proved that in most of the financial history that deflation is the norm...

They have talked about inflation for two years, and there is still no inflation. . . . Copper is going down. Crude is going down, and we have a deflation problem, not an inflation problem."

Nenner is predicting interest rates "are going down" and not up in the foreseeable future.

Nenner is also calling for the stock market to go on a "downward slide through the year 2020." Nenner says, "I can't explain it, but the cycle topped, and the cycle is down until 2021."

How bad will it be? Nenner says, "Very bad."

"I called for Dow Jones 5,000, and I still call for Dow Jones 5,000...

It's going to be a blood bath, but as I said the last time, in the 1990's when the Dow was 5,000, the world still looked okay."

Is there a big debt reset coming? Nenner says,

"The last time we were in this situation was when Roosevelt was President. It was very interesting because they paid off only 25% on the dollar because the inflation that came.

Now, the problem is if you don't have inflation, you still owe the whole amount of money. This is why they urgently need this inflation. So, the value of the money goes down, and you have to pay off less. There is no inflation. So, it is a big problem, but they can keep this going forever. I don't think it's a problem because countries can keep printing money as long as they want."

The other big cycle Nenner has been seeing is the so-called "war cycle." Nenner says,

"The next four or five years in this war cycle is very dangerous."

On gold and silver, Nenner is bullish, but "not until after this summer."


After the Interview: 

Charles Nenner points out if you look back every year that ended in the number 7, it was a market top year. He said, "2017 will follow the same pattern as 2007, 1997, 1987, 1977, 1967, 1957, 1947 and 1937."  Nenner contends 1927 was supposed to be a market top year, but things got distorted and it was pushed off until 1929.

Nenner predicts the next market crash will not be quite as bad as 1929, but it will be bad.

Moving Average Bounces Getting Weaker And Weaker: Mish Warns "Major Carnage Coming"


Bounces off the 200 Day exponential moving average lines keep getting weaker for all the major indexes.

S&P Daily

Russell 2000 Daily


Nasdaq 100 Daily


When those moving average bounces fail, and they will, what then?

For the answer, let's look at weekly charts.

Dow Weekly


S&P 500 Weekly


Russell 2000 Weekly


Nasdaq 100 Weekly


Those 50-week exponential moving averages will break. When that happens I expect a quick plunge to the 200-week EMA.

Will that be the end? If I am right, that's not even close.

I expect all the gains back to 2007 to be wiped out. To visualize, we need to look at monthly EMAs.

Dow Monthly


S&P 500 Monthly


Russell 2000 Monthly


Nasdaq 100 Monthly


With the exception of the Nasdaq 100, a decline to what is now the 200-month EMA would take us to where I believe we are headed.

Superbear?

Does this make me a superbear?

Hardly.

John Hussman, who does excellent technical and fundamental work is far more bearish: "I Expect the S&P 500 to Lose 2/3 of Its Value"said Hussman in January.

My charts suggest about 50% except for the Nasdaq.

Pension Fund Disaster

The sad part of this story is that despite the biggest bull market in history, pension funds are extremely underfunded.

Whether the decline is 33%, 50%, or 66%, pension funds will get crushed.

Heck, given 7% per-year assumptions, even flat returns for seven years will destroy many if not most of them.


By the way, asset bubble bursting episodes are anything but inflationary. If you think massive inflation is right around the bend, please think again: Velocity of Money Picks Up: Inflation Coming? Stagflation? How About Deflation?

Greg "The Big Short" Lippmann Says Corporates Will Cause The Next Crisis

Former Deutsche Bank trader Greg Lippmann is best known for having worn t-shirts with the logo "I am short your house" just before the financial crisis hit, and the US housing market imploded (making Lippmann very rich in the process). Logically, he is also very well-known for designing the trade against subprime mortgages that became known as the Big Short.

Well, Greg "The Big Short" Lippmann is back with a new warning, telling Bloomberg that the next crisis will emerge from corporate debt. Speaking at the Milken Conference, the former MBS trader who now runs his own, $3 billion hedge fund LibreMax Capital, told Bloomberg's Erik Shatzker that corporate debt and equities will face the biggest pain when the next downturn comes; meanwhile unlike the last crisis, investments linked to consumer debt should be relatively safe as companies have been the ones gorging the most on the ultra cheap interest rates during the past decade (alas, this is yet another analysis that avoids the impact of student and auto loans, which have taken consumer debt to new all time highs).

"If the first quarter's volatility is a harbinger of something bigger, I think that you're going to see a lot more trouble in the corporate market and the equity market than the structured products market," Lippmann said during a Bloomberg interview in Beverly Hills. "The consumer is in much better shape than corporates. Consumers are less levered than they were pre-crisis. Corporates are more levered than they were pre-crisis, and I think structured products are not going to be the epicenter."

Lippmann also predicted that while the next recession may not be imminent, "it is on the horizon" and will be less severe but longer than the global financial crisis of 2008 and 2009. It's likely to be more akin to 2000 through 2002, he said.

Of course, Lippmann has a reason to be bullish on structured products and bearish on corporates: he said that his fund has been heavily investing in other structured products such as commercial mortgage securities, collateralized loan obligations and student-loan investments. The fund has also shifted into the debt of some companies with exposure to real estate, such as homebuilders. One may almost call Lippmann "the big long."

"I Expect A Financial Accident To Occur": Gavekal Reveals A New, "Flashing Red" Warning

Much ink has been spilled by analysts sounding the alarm over the rapid flattening in the US Treasury yield curve observed over the past year, as many have rushed to remind markets of the conventional wisdom that an inverted curve is one of the most reliable indicator of an imminent recession.

At the same time, others have spoken out against this orthodoxy, pointing out that there can be as much as a 1-2 year lag between the moment of first inversion and when the economic contraction officially arrives.

Yet others, note that due to the Fed's direct influence on the long end (where the market tends to frontrun central bank monetization of Treasuries), the yield curve - which represents the market rate of interest on the short end, and the natural rate of interest, or "r star" on the long-end - has lost all signalling value.

Now, in a hybrid take on the yield curve concept, GaveKal's Charles Gave says that the yield curve is certainly informative... just not that of the public sector, but the private sector instead.

According to Gave, recession timers should ignore government debt and focus instead on the corporate credit market. Here, the U.S. natural rate of interest can be represented by yields on longer-dated industrial bond rated Baa by Moody's, while the market rate is captured by the prime lending rate charged by U.S. banks.

The problem is that if Gave's interpretation is right, the US economy is about to fall off a cliff.

"The private sector yield curve reading stands at zero, or right on the threshold where trouble can be expected to begin" Gave wrote today in a note to clients, quoted by Bloomberg. "Should this spread move into negative territory, I would expect a financial accident to occur outside of the U.S., a U.S. recession, or possibly both."

Translation: even the smallest deviation from the current unstable equilibrium could unlock a recession.

Looking at the chart above, Gave warns that either a U.S. recession has taken place within a year of the private sector yield curve inverting, or a "financial accident" has occurred in other economies with currencies linked to the dollar, which would be all of them.

Why does Gave pick this particular spread? Because as he explains, artificially depressed prime rates below the natural rate of corporate credit have allowed banks to generate "artificial" money, kept "zombie" companies alive, but most of all permitted most viable corporations to engage in "financial engineering" such as issuing debt to repurchase stocks, all of which are predicated on cheap borrowing costs continuing indefinitely; the risk of course, is that the credit-funded party ends once the curve inverts, Gave said.

Based on this measure, "we are entering dangerous territory," he concluded. If the private sector curve inverts, then zombie companies - the same ones we highlighted back in March as surviving only thanks to central bank generosity - "which will fail and capital spending will be cut, as firms move to service debt and repay principal. Workers will get laid off and the economy will move into recession."

In summary: to Gave the curve is not only informative, but is indeed flashing a "red warning", one which suggest a "financial accident is about to occur", only it's not the government curve, but the corporate curve where this particular Cassandra can be found.

martedì 24 aprile 2018

$1B Portfolio Manager: "Tesla Reminds Me of Enron"

Montana Skeptic is a well known Tesla skeptic and short seller who writes frequently on Seeking Alpha and has over 4,000 followers. He manages a $1B+ portfolio for a family office and invests using bonds, equities, hedge funds, and private investments with a wide geographical and asset class dispersion. He has a J.D. degree from Yale Law School and he practiced for 30 years as a trial lawyer in commercial cases.

Case-Shiller Home Prices Surge At Fastest Pace Since 2014 To Record High

US National Home Prices in February are now almost 7% above the 2006 peak according to the latest Case-Shiller data and are surging at 6.8% YoY - the fastest pace since June 2014.

The data showed monthly gains in all 20 cities, including strong advances in expensive areas such as Seattle and Los Angeles, along with cheaper regions including Cleveland and Detroit.

All 20 cities in the index showed year-over-year gains, led by a 12.7 percent increase in Seattle and an 11.6 percent advance in Las Vegas; Washington was slowest at 2.4 percent

This pushed the national home price to a new record high...

"With expectations for continued economic growth and further employment gains, the current run of rising prices is likely to continue," David Blitzer, chairman of the S&P index committee, said in a statement.

Richmond Fed Survey Crashes By Most In 25 Years

When hope dies... against expectations of a small rise from March to a 16 print, April came in at a disastrous -3 (the worst data since Sept 2016).

From record highs just a couple months ago, Richmond Fed manufacturing has crashed by the most in the survey's 25 year history into contraction...

It was a bloodbath below the surface too.

New orders collapsed to -9 from +17, order backlogs plunged to -4 from +10 and while wages and employees rose, workweek dropped notably.

Finally, prices paid rose once again even as new orders crashed...

Must be the weather, right?

This Is 'Not' The Reagan Stock Market

Facts do not matter anymore.  Opinions are now facts.  We truly live in dangerous times.

Reagan And Trump Stock Market

We were stunned by an article posted on the CNBC website over the weekend, The Trump stock market looks a lot like Ronald Reagan's, Ralph Acampora says – and that may mean trouble.

Are you fricking kidding me?  Nothing could be further from the truth.

The Reagan market looks like the Trump market?   The Trump S&P500 is almost 40 percent above the Reagan S&P after 365 trading days from the election.

We do agree on the last part of the headline that stocks are headed for trouble, however.

Presidents And Stock Markets


JFK-Trump S&P500 Analog

Our latest venture  has been constructing and tracking the stunningly tight JFK-Trump S&P500 analog.  We did not just stumble upon the analog with a feeling or a religious epiphany, randomly deciding to "overlay two charts on top of each other" (a common criticism of analogs)  but we crunched 70 years of data searching for similar volatility shocks to the one the market experienced in early February.

We found three:  1) The Eisenhower heart attack in 1955; 2) the 1987 stock market crash, and 3) the 1962 "Kennedy Slide" or bear market.   We dismissed the Eisenhower shock as it did not even lead to an official correction, and the 1987 bear market — peak to trough — was over in just 39 days.

Is The Trump Market Similar To The Reagan Market?

Absurd. Take a look at the data in the first analog and you decide.

The JFK-Trump analog is only 84 bps points apart with respect to price-performance 365 trading days after the election whereas the Reagan-Trump analog illustrates an almost 40 percent divergence.

(Click here for interview)

We love Ralph, but we are having trouble reconciling his comments to CNBC.

"In fact, if you look at the chart you will see Ronald Reagan had a six-month honeymoon.  It lasted…I think the percentage gain was roughly about ten percent." – Ralph Acampora

Ralph seems to refer to the Dow instead of the S&P, so we included it in the analog.

As the chart illustrates, Reagan's S&P500 peaked 18 days after election day, rising 8.9 percent bolstered by the surprise November 4th electoral landslide.  The S&P then fell 27.15 percent over the next 430 trading days, bottoming on August 12, 1982.

The Reagan bull market ignited that August day, taking the S&P500 up over 61 percent through 1983 and 179.86 percent by the end of his two terms.

Much of the stock volatility during the first 18 months of Mr. Reagan's first term was due to very tight monetary policy, a deep recession, and volatile interest rates.

On election day, for example, the yield on the 10-year was 12.46 percent.  The yield continued to rise, finally peaking at 15.84 percent on September 30, 1981, almost a year before the economy emerged from recession and the August 1982 stock market bottom.

Reagan's Tailwinds, Trump's Headwinds

We posted a piece in December 2016 comparing the macro initial conditions between the Reagan and Trump administrations on the eve of their presidencies,  Reagan v Trump Macro Initial Conditions, listing several indicators,  including monetary, oil prices, and demographics.  Our conclusion was a Reagan-like bull market is very unlikely during Trump's tenure.

President Reagan also got his recession out of the way early in his administration

Segue To North Korea

Finally, this exercise reminds me of conversations I have had with friends about the upcoming U.S.-North Korea summit.  As you have probably read, we are worried the U.S. is going to be played by the NorKo's and Chinese like the dueling banjos in Deliverance.

What always comes up is whether President Trump's hardline and bluster toward Kim Young Un has worked and brought North Korea to the table.   I have tried to present the facts, as, say, a CIA desk officer at the U.S. embassy in South Korea (still without an U.S. Ambassador, BTW) would.

Sure, I have my biases and confess I'm not a big fan of President Trump's policies or his behavior.

But here are the facts:

In the first eleven months of the Trump Administration, the North Koreans engaged in twenty missile tests, some nuclear,  compared to only eight during the entire two terms of President Obama.

During Trump's first year in office, North Korea conducted more than twice as many ballistic missile tests (20) as it did during the first year of Barack Obama's presidency (8).  – Foreign Affairs

I maintain the president's bluster and the painting of many red lines baited Kim into mocking and ultimately crossing them, twenty times, to be exact.  Two of the six missiles fired by the North Koreans over Japan occurred in 2017.

It was during these last missile and weapons tests,  North Korea probably obtained their big nuke and ICBM delivery system.

Kim is now finally prepared for nuclear chastity.  That is after the hermit kingdom has lost its thermonuclear virginity.

North Korea has promised to end all its atomic and missile tests – but experts warned last night that the dramatic pledge may mean the rogue state has already perfected its nuclear weapons system.

Dictator Kim Jong Un's surprise announcement comes prior to a planned summit with President Donald Trump next month.

But while some have greeted the offer as a welcome sign of peace, a leading ex-CIA analyst said the Communist despot may have already achieved his ambition of creating a weapons system capable of hitting any target in the US. – Daily Mail

North Korea now comes to the table stronger than ever and most likely with some sort of secret deal in pocket with the Chinese.

Without equivocating, it's fair to say that both the declarations on nuclear testing and on halting the tests of ICBMs are significant concessions. Specifically, Kim announced that North Korea will "discontinue nuclear testing" and that the Punggye-ri site will be "dismantled to transparently guarantee the discontinuance of the nuclear test [sic]." On ICBMs, Kim simply said that no "inter-continental ballistic rocket test-fire" would take place after April 21, 2018.

While significant, we shouldn't be fooled into thinking that these concessions are being made out of a position of weakness or as a necessary show of bona fide goodwill to South Korea and the United States before the upcoming summits. Kim's rationale for doing away with the nuclear test site was to underline that North Korea had already successfully come up with the nuclear weapons designs it needed. – Daily Beast

There were many articles over the weekend on the wisdom of even holding the summit.

 White House privately skeptical of North Korea's plans to freeze nuclear testing  – Washington Post

Mr. Kim's moves are also unsettling officials in the U.S., Japan and China. Some suspect he is merely posturing in advance of the meeting, as well as before a separate one with South Korea's president. Others worry that his gestures could put Mr. Trump on the defensive in the grinding negotiations over the future of North Korea's nuclear weapons.  – NY Times

Trump tempers expectations on North Korea  – Politico

Both leaders go into the meeting leader that are impulsive, unprepared, and the U.S. is way understaffed in its expertise and professional diplomatic corps.

Moreover, both sides don't even seem to be in the same zip code in terms of perspective, motive, and expectations.

The North Koreans seem to believe that their nuclear breakthroughs forced Mr. Trump to accede to a leaders' summit meeting, something they have long desired as a way to prove themselves a peer of the major powers.

But American officials have said Mr. Kim was the one forced to the table, compelled there by American sanctions and military threats.

North Korea's statements suggests that the country sees itself as on the verge of forcing the world to accept it as it is, finally securing its long-term survival.
– NY Times 

Let's just say we are not expecting a Reagan-Gorbachev breakthrough.

By the way,  our friends seem to think Trump deserves the Nobel Prize based on their feelings, fantasies,  and the spin that is swirling about the ether and Twittersphere.

We sincerely hope they are correct,  but we fear disaster based on our observation of the facts.  Both sides are about to engage in a high-wire act without a safety net.

Has the market priced the risk?

And the Reagan stock market is the Trump stock market.