MARKET FLASH:

"It seems the donkey is laughing, but he instead is braying (l'asino sembra ridere ma in realtà raglia)": si veda sotto "1927-1933: Pompous Prognosticators" per avere la conferma che la storia non si ripete ma fà la rima.


domenica 11 marzo 2018

The $233 Trillion Dollar Dark Cloud Of Global Debt


Global debt has reached record heights without any signs of relief. While central bankers try to explain away the phenomenon of these out-of-control numbers, it's not much of a mystery. Immediate consumption with the promise of repayment sometime in the future has consequences.

Global debt is staggering to the point most of it will never be repaid. Certainly not in our generation. Perhaps by our grandchildren, but as global debt keeps mounting, the picture is doubtful.

The per capita global debt is $30,000. Who, exactly, will be making repayments?

Economists insist that the 2007 financial crisis could not have been predicted. Yet, all the signs of out-of-control credit where there. Today, economists are repeating the same mantra, despite the spiraling world debt. The question is not if the next bubble will strike. It's a matter of when.

The math is fairly simple. The more a country increases its debt to simply stay afloat, the more like the increasing debt will cause a tightening of credit. The next step in the equation is a burst bubble and economic crisis. This is what happened in 1929, happened again in 2007, and it's happening now. Past behavior is the best predictor of future behavior.

Out-of-control credit will undoubtedly slow down the US's current economic growth.It probably won't cause an outright crisis. Other countries may not be as fortunate.

Countries such as China, Belgium, South Korea, Australia, and Canada are experiencing an unprecedented credit bubble, with few systems in place to control it.The resulted inflation or simply write-offs of debts could result in a global financial disaster we have not seen before. The current economic upswing is unlikely to continue.

Prior to 2007, globalization, the exchange of goods and services between countries, was at its highest level. Since then, globalization has leveled off. We may have seen the peak of globalization. Emerging countries, benefiting from globalization, have raised their standard of living and cheap goods are no longer crossing borders with the same abandon. Countries are instituting nationalistic protectionist measures to protect their own economy. Globalization is giving way to "islandization," where the movement of capital and good across borders is being limited instead of expanded. This limited global trading, along with rising geopolitical tensions, will negatively affect global economic expansion, while the global debt is still spiraling out of control.

The global economy is also currently suffering from limited growth in productivity. The reasons for this are wide-ranging, from an aging labor force, reduced investments, neglected infrastructures, reduced entrepreneurship and the general uncertainty how to resolve these problems.

If a global crisis is to be averted, leaders need to act instead of remaining complacent. Proper skills training and greater emphasis on investments can lead to the productivity growth that can create the global expansion necessary to tame the current debt cycle.

If leaders make the right choices, our grandchildren may not face the economic crisis which currently appears to the only legacy they will inherit.

Oil is setting up for a turbulent year.

In an industry that is always full of contradictions, 2018 has been a particularly complicated and divisive year for the global oil markets–and it looks like it won't be letting up any time soon.

For months, the Organization of Petroleum Exporting Countries (OPEC) has been pushing for a dramatic decrease in production in the interest of bolstering prices at the pump. They've even managed to get major OPEC outsiders like Russia and the oil cartel to agree to production cuts. While the original deal is due to expire at the end of March, 2018, OPEC has just extended the production caps to the end of the year in an attempt to counterbalance the global glut of crude oil.

However, despite OPEC's best efforts, some countries are not stemming the flow of crude, and some are even ramping up production and even opening new major oil fields. Nigeria, for example, is talking out of both sides of its mouth, promising compliance with OPEC in the same year that it has pushed its output to the highest level in more than two years and is set to start up production in a new large-scale oil field by the end of the year, their first in half a decade.

Now, another major issue has arisen. British Petroleum (BP), which has long expected their mature oil fields to naturally plateau and then decrease in production, has now announced that their legacy fields are increasing output, to the great surprise of experts in the field and BP executives alike. An astonished Bob Dudley, BP's chief executive officer, told an interviewer at the CERAWeek by IHS Markit energy conference in Houston that he, "cannot remember ever in my career having seen a negative decline rate."

This unprecedented increase from mature fields adds another problem to OPEC's plan on top of the already major issue of the shale boom. And BP isn't the only supermajor contributing to the problem. Shockingly high results from legacy fields have also been observed by mega-producers including Shell Plc and in areas like Norway, the North Sea, and Russia (all regions highlighted by the International Energy Agency (IEA) for their remarkable recent output) creating a major headache for Saudi Arabia, who was shouldering the major brunt of OPEC cutbacks, cutting a jaw-dropping 1.8 million barrels per day in a desperate attempt to recalibrate the market price of oil.

While BP has had the most dramatic turnaround by a wide margin, other companies have still reported some pretty impressive findings, creating quite an upset for OPEC's master plan. While mature oil fields' production did drop last year, it was the smallest drop in a decade of collected data at just 5.7 percent, according to figures from the IEA.

The slowing decline in these fields is a huge surprise in any scenario, but it's made all the more confounding by the fact that the oil industry radically decreased spending during the pricing downturn of the last three years–a downturn that they were just finally coming out of. Since mature wells are usually a huge money pit in terms of maintenance, OPEC had been extremely hopeful and even dependent on the expectation that mature wells would decline significantly without major investment–especially since these legacy wells still account for more than half of the world's oil production.

According to some supermajors, however, the economic downturn had exactly the opposite effect. As explained by Wael Sawan, the executive vice-president focused on deep water at Shell, thriftier times have called for a re-strategizing and getting back to basics. This means focusing on existing wells and mature oil fields instead of drilling and prospecting in a short-term effort to get more oil more cheaply and efficiently.

It's all a response to the same issue — low oil prices — but with exactly the opposite approach from OPEC, setting oil up for a turbulent year as income-boosting strategies clash. OPEC is trying to keep its eye on the horizon, with long-term goals to increase global oil prices not just for this year, but going forward, but all of the production cuts are for naught if private companies continue to act in their own short-term best interest, increasing their income by putting more and more oil into an already saturated market. 

"Where To From Here": Why Goldman's Client Are Confused

Badk in early February, after the great volatility explosion which sent the VIX to 50, killed the XIV ETF and which we now know was precipitated by the market's misreading of the sharp January rising average hourly earnings print (which just as we said at the time, was due to a drop in the workweek and little else as the latest BLS data revisions confirmed), Goldman's clients wanted to know one thing: "how much worse will it get?" In response, Goldman's chief equity strategist David Kostin answered "not much", and indeed so far he has been proven correct as not only is the Nasdaq back to all time highs, but the S&P has recouped virtually all of its 10% correction.

One month later, with the market once again soaring, things are even more confusing because while the vol scare may have come and gone for now, two other risks remain, namely rising interest rates and the escalating trade conflict, both of which according to Goldman "have ended the "Goldilocks" environment of 2017." And yet, as Citi lamented overnight, the markets remain oblivious.

Adding to this, a somewhat puzzled Kostin writes in his latest Weekly Kickstart, that "with 10-year Treasury yields now at 2.9% and new tariffs on steel and aluminum formally ordered this week, the ratio of return/realized volatility has declined from 3.3 in 2017 (22% / 7%) to 0.3 YTD. The S&P 500 nonetheless remains in positive territory."

This confusion appears to be spreading, and has in turn prompted Goldman's clients to ask, "where to from here?"

Kostin's answer is two-fold, first focusing on the move higher in rates, and why there may be less to it than some bears insist:

Interest rates present a more substantial risk to equity valuations than they do to earnings. Because corporate borrow costs are historically low and interest coverage is still elevated, we estimate that a 100 bp increase in 10-year Treasury yields would reduce S&P 500 return on equity ("ROE"), excluding Financials, by less than 50 bp (from a current level of 19%). Financial earnings benefit from high rates, so the overall impact on S&P 500 profitability is  surprisingly small.

The speed of rising interest rates poses a more immediate risk to equities than does the level of rates. This week we published an analysis of the relationship between bond yields, corporate growth, and equity valuations. One key observation from our analysis was that S&P 500 prices typically stop increasing when rates rise more quickly than a standard deviation in a month (currently equating to a rise in Treasury yields of roughly 20 bp), and equity prices decline when yields rise by more than two standard deviations (40 bp). This relationship has held true during the last 50 years irrespective of whether rising yields were driven by inflation or real rates.

The level of Treasury yields eventually also matters for equities, even if the change occurs gradually. Our dividend discount model framework suggests that 10-year Treasury yields above 4% – which would require substantial Fed tightening from current levels and/or inflation expectations well above the 2% target – would outweigh any potential reduction in the equity risk premium ("ERP"), and therefore lead to lower equity valuations.

Incremental medium-term growth needed to offset change in bond yields and ERP

Concluding the rates discussion, Kostin reminds clients that Goldman economists expect 10-year Treasury yields to gradually rise to 3.25% by the end of 2018 and 3.6% by the end of 2019.

"The combination of eight Fed rate hikes by the end of 2019, rising inflation expectations, and a higher term premium will lift the yield curve."

Unless, of course, the move is not a gradual, linear levitation but a sharp, staccato spike a la the Taper Tantrum, in which case all bets are off.

What one can also highlight here, is that after an initial scare following the sharp move to just shy of 3.0% a month ago, equities have indeed eased back, and now interpret any gradual increases in the 10Y rate as a neutral, if not benign development. The question of course, is what happens once 3.0% is breached and whether what has been a moderate selloff re-accelerates, once again slamming risk assets.

* * *

Which brings us to the second, and more material recent development, which is proving to be a bigger source of confusion for Goldman clients, namely the growing trade conflict and why do stocks refuse to go down as a result? 

As a reminder, the steel and aluminum tariffs signed by President Trump this week will go into effect on March 23. The order also exempts Canada and Mexico as leverage during the Nafta negotiations, and leaves open the possibility for other country and product exemptions.


From a fundamental perspective, and echoing what Barclays said two weeks ago, Goldman reiterates that these tariffs should have a de minimis effect on aggregate US economic and earnings growth. In fact, together the steel and aluminum industries account for just 0.1% of national employment and 1% of industrial production. In aggregate, Kostin notes that "these commodity inputs equate to just 1% of total US private industry gross output (i.e., revenues), meaning even significantly higher steel and aluminum input costs would have a limited impact on aggregate US corporate profits."

That said, as Goldman cautioned one week ago, downstream users of the metals including autos and machinery stocks will likely face margin pressures from higher domestic input prices. In general, industries with high material intensity and low margins (the bottom right of Exhibit 2) face the highest risk from rising commodity costs, whether due to tariffs or other causes.

And if a direct threat to the US economy as a result of Trump's trade war is - as of now - nonexistant, what is the danger? Here Kostin once again echoes Barclays, and writes that the larger threat to corporate earnings and equity valuations is the potential for escalating trade conflict in response to these tariffs.

Our economists believe retaliation by US trading partners is likely, particularly in the form of tariffs on US metals, luxury consumer goods, and agriculture. Our commodity analysts highlight soybean exports as particularly vulnerable to retaliation from China. In addition, the upcoming release of the US Section 301 investigation regarding intellectual property may lead to further conflict with China, potentially jeopardizing US corporate sales to and supply chains in China.

And here a paradox: just like Citi's Matt King continues to rage against the market's seemingly infinite complacency when faced with shrinking central bank balance sheets, prompting him to ask "we know what central banks are doing... why are we so slow to price that in?", so the advent of a trade war has so far prompted nothing more than a yawn from investors, who appear convinced that there is no threat to risk assets as a result of potential trade war escalation. Here's Goldman:

Although equity prices have moved in reaction to the proposed metals tariffs, investors do not appear concerned about escalating trade conflict. Firms that our analysts have highlighted as vulnerable to rising steel and aluminum  input costs have underperformed the Industrials sector by more than 300 bp in the last two weeks. However, the share prices of agriculture firms, luxury consumer companies, and TMT firms with high imported COGS have generally demonstrated no signs of concern (see Exhibit 3).

Even more bizarre is that contrary to conventional wisdom, "baskets of US stocks with the largest international sales in general and specific exposure to Europe and China have all outperformed the S&P 500 in recent weeks" (see Exhibit 4), almost as if the market is rewarding those companies that are on the front line of the trade war

Finally, Goldman claims that the outperformance of the domestic-facing Russell 2000 over the S&P 500 by 300 bp this month, is not due to trade concerns, but rather "positioning and earlier underperformance appear more likely causes."

* * *

So, going back to the original question posed by Goldman clients, "where to from here", the answer appears to be more of the same, with new S&P all time highs imminent.

Here, Kostin underscores that despite the sharp VIX moves, the rising rates, and trade conflict, "strong economic and earnings growth should continue to lift US equity prices during 2018. Our economists' Current Activity Indicator signals a 4.8% current pace of US economic activity, and consensus expects that next month S&P 500 firms will report year/year EPS growth of 17% in 1Q."

This "strong growth environment" helps explain the return of the honey badger market which is ignoring any potentially adverse news, as well as the resilience of equity prices and investor sentiment.

* * *

Looking forward, Kostin believes that the S&P 500 will rise a further 4% by year end to 2850 "on the strength of earnings growth rather than P/E multiple expansion."

It's not all good news: "uncertainty surrounding interest rates and trade conflict suggests that the return and volatility environment will look more like it has in recent weeks than during the "Goldilocks" environment of 2017."

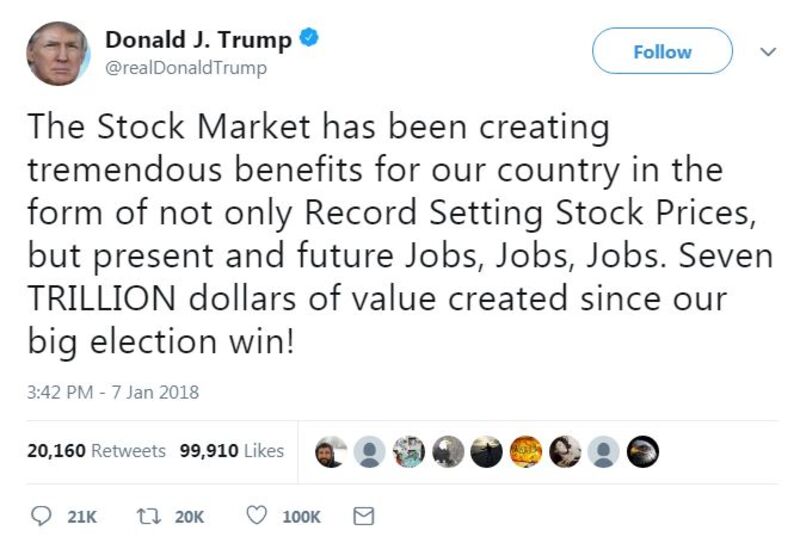
But the biggest winner of the recent market moves is none other than Donald Trump, who - due to luck or otherwise - managed to not only broaden his populist appeal by launching a (very limited) trade war (which so far excludes Canada and Mexico) and at the same time, has not only kept his favorite metric of the success of his presidency - the stock market - from crashing, but at this pace, stocks appear on track to make new all time highs in the coming days.

QE Unwind Is Too Slow, Says Fed Governor, Thus Launching First Trial Balloon

"The very slow pace may still be contributing to a buildup of various financial imbalances."

So we have the first Fed Governor and member of the policy-setting FOMC who came out and said that the QE Unwind that began last October with baby steps isn't fast enough. And because it's so slow it may actually contribute to, rather than lower, the "financial imbalances."

In her speech, Kansas City Fed President Esther George pointed at the growth of the economy, the tightness in the labor market, the additional support the economy will get from consumers and companies as they spend or invest the tax cuts, etc., etc. And despite this growth, "the stance of monetary policy remains quite accommodative," she said.

She cited the federal funds rate – the overnight interest rate the Fed targets. The Fed's current target range is 1.25% to 1.50%, which is "well below estimates of its longer-run value of around 3%," she said.

The Fed would have to raise rates at least six more times of 25 basis points each, for a total of at least 1.5 percentage points, to bring the federal funds rate to around 3% and get back to neutral. If the Fed wanted to actually tighten after that, it would have to raise rates further. So far, so good.

And then came her concerns about the Fed's balance sheet.

Under QE, the Fed acquired $1.7 trillion in Treasury securities and $1.78 trillion in mortgage-backed securities, for a total of about $3.5 trillion. After QE ended in October 2014, the Fed then maintained the levels by replacing maturing securities.

But in October last year, it commenced the QE-Unwind and started to not replace some maturing securities. This has the effect of shrinking its balance sheet. Just like the Fed "tapered" QE by phasing it out over the course of a year, it is also ramping up the QE-Unwind over the course of a year.

But the pace of the QE-Unwind has been too slow, according to George – and this may be destabilizing the financial markets:

By the end of this year, however, only about a quarter of the increase to the Fed's balance sheet resulting from the first round of large scale asset purchases will be unwound.

These holdings of longer-term assets were intended to put downward pressure on longer term interest rates. Many investors responded, as would be expected, by purchasing riskier assets in a reach for higher yield. As a result, asset prices may have become distorted relative to the economic fundamentals.

The reference to "distorted" asset prices is the same verse we've heard from other Fed governors: Asset prices have become inflated. Since assets are leveraged, they have become a risk to financial stability. Then she adds:

The very slow pace of our balance sheet normalization may still be contributing to a buildup of various financial imbalances.

In other words, because the QE Unwind is so slow, it doesn't really work as an unwind but continues to inflate asset prices, which would be the opposite of what the Fed wants to accomplish:

While until recently, financial markets remained remarkably stable, it is not uncommon to see volatility rise when asset prices become inflated and investors struggle to find a new equilibrium.

And there she left us hanging at the edge of the cliff, without saying more about the QE Unwind and where it should go. Instead, she reverted to less treacherous territory of interest rates. But later, at the very end of the conclusion, she fired her final shot:

Given the current momentum in the economy, the FOMC will need to carefully calibrate its policy to lean against a potential buildup of inflationary pressure or financial market imbalances.

Let me repeat this: the Fed will "need to carefully calibrate its policy to lean against … financial market imbalances."

Esther George has been one of the more hawkish FOMC members. So it's probably her job to launch the first trial balloon about speeding up the QE Unwind.

The whole idea of unwinding QE was launched by trial balloon, one after the other, even as people said that QE could never be unwound, that in fact these assets would have to remain on the Fed's balance sheet permanently. But gradually, it sank in that the Fed was seriously thinking about shedding those assets. In June 2017, it announced the mechanics. In September, it announced the amounts and timing. It took over a year to get there. And because it was rubbed in so gently, the markets barely reacted to it.

George is in a non-voting slot on the FOMC this year. So she is a safe bet to launch the first trial balloon. The markets won't take her seriously – just another Fed governor talking. But this is how it starts. The Fed no longer administers "monetary shocks," the way it used to in order to knuckle its monetary policies into the recalcitrant markets. Now it's all jawboning and "forward guidance" and trial balloons.

But it does show that there is some thinking behind the scenes about speeding up the QE-Unwind. Once the pace is ramped up to full speed by October this year, the Fed will shed up to $50 billion a month in securities — up to $30 billion in Treasuries and up to $20 billion in MBS — for a maximum of $600 billion a year.

But any significant acceleration is impossible to achieve by just allowing maturing securities to "roll off" without replacement: In most months, there are only about $30 billion to $35 billion of Treasuries on the Fed's balance sheet that mature. For example, in March, $31.2 billion mature; in April, $30.5 billion. MBS come on top of that.

So if she is proposing to increase significantly the pace, it would have to be done by outright selling securities into the market, which would further change the dynamics of the market, just when the US Treasury will be issuing a record amount of new debt to finance the growing deficits. In order to find buyers for all those Treasuries that would flood the market, the yields would have to rise to be very appealing, so that investors would buy Treasuries rather than other securities. When yields rise, by definition bond prices fall. This would ricochet throughout the market with a substantive repricing of all assets.

And it would come at the same time that the ECB will have stopped its QE purchases and that the Bank of Japan is starting to think out loud about an "exit," as they call it. And this would make for an interesting confluence of factors.

Investors in the corporate bond market, particularly in junk bonds, are still blowing off the Fed. But not much longer. 

sabato 10 marzo 2018

Forget "Free Trade" - It's All About Capital Flows


In a world dominated by mobile capital, mobile capital is the comparative advantage.

Defenders and critics of "free trade" and globalization tend to present the issue as either/or: it's inherently good or bad. In the real world, it's not that simple. The confusion starts with defining free trade (and by extension, globalization).

In the classical definition of free trade espoused by 18th century British economist David Ricardo, trade is generally thought of as goods being shipped from one nation to another to take advantage of what Ricardo termed comparative advantage: nations would benefit by exporting whatever they produced efficiently and importing what they did not produce efficiently. While Ricardo's concept of free trade is intuitively appealing because it is win-win for importer and exporter, it doesn't describe the consequences of the mobility of capital. Capital--cash, credit, tools and the intangible capital of expertise--moves freely around the globe seeking the highest possible return, pursuing the prime directive of capital: expand or die.

Capital that fails to expand will stagnate or shrink. If the contraction continues unchecked, the capital eventually vanishes.

The mobility of capital radically alters the simplistic 18th century view of free trade. In today's world, trade can not be coherently measured as goods moving between nations, because capital from the importing nation owns the productive assets in the exporting nation. If Apple owns a factory (or joint venture) in China and collects virtually all the profits from the iGadgets produced there, this reality cannot be captured by the models of simple trade described by Ricardo.

In today's globalized version of "free trade," mobile capital can arbitrage labor, currencies, interest rates, regulatory burdens and political favors by shifting between nations and assets. Trying to account for trade in the 18th century manner of goods shipped between nations is nonsensical when components come from a number of nations and profits flow not to the nation of origin but to the owners of capital.

This was recently described in a Foreign Affairs article, (Mis)leading Indicators:

If trade numbers more accurately accounted for how products are made, it is possible that the United States would not have any trade deficit at all with China. The problem, in short, is that trade figures are currently calculated based on the assumption that each product has a single country of origin and that the declared value of that product goes to that country.

Thus, every time an iPhone or an iPad rolls off the factory floors of Foxconn (Apple's main contractor in China) and travels to the port of Long Beach, California, it is counted as an import from China, since that is where it undergoes its final "substantial transformation," which is the criterion the WTO uses to determine which goods to assign to which countries.

Every iPhone that Apple sells in the United States adds roughly $200 to the U.S.-Chinese trade deficit, according to the calculations of three economists who looked at the issue in 2010. That means that by 2013, Apple's U.S. iPhone sales alone were adding $6-$8 billion to the trade deficit with China every year, if not more.

A more reasonable standard, of course, would recognize that iPhones and iPads do not have a single country of origin. More than a dozen companies from at least five countries supply parts for them. Infineon Technologies, in Germany, makes the wireless chip; Toshiba, in Japan, manufactures the touchscreen; and Broadcom, in the United States, makes the Bluetooth chips that let the devices connect to wireless headsets or keyboards.

Analysts differ over how much of the final price of an iPhone or an iPad should be assigned to what country, but no one disputes that the largest slice should go not to China but to the United States. That intellectual property, along with the marketing, is the largest source of the iPhone's value.

Taking these facts into account would leave China, the supposed country of origin, with a paltry piece of the pie. Analysts estimate that as little as $10 of the value of every iPhone or iPad actually ends up in the Chinese economy, in the form of income paid directly to Foxconn or other contractors.

In a world dominated by mobile capital, mobile capital is the comparative advantage. Mobile capital can borrow billions of dollars (or equivalent) in one nation at low rates of interest and then use that money to outbid domestic capital for assets in another nation with few sources of credit.

Mobile capital can overwhelm the local political system, buying favors and cutting deals, all with cash borrowed at near-zero interest rates. Mobile capital can buy up and exploit resources and cheap labor until the resource is depleted or competition cuts profit margins. At that point, mobile capital closes the factories, fires the employees and moves on.

Where is the "free trade" in a world in which the comparative advantage is held by mobile capital? And what gives mobile capital its essentially unlimited leverage? Central banks issuing trillions of dollars in nearly-free money to banks and other financial institutions that funnel the free cash to corporations and financiers, who can then roam the world snapping up assets and arbitraging global imbalances with nearly-free money.

There's nothing remotely "free" about trade based not on Ricardo's simple concept of comparative advantage but on capital flows unleashed by central bank liquidity.

The gains reaped by mobile capital flow to those who control mobile capital: global corporations, financiers and banks. No wonder labor's share of the economy is stagnating across the globe while corporate profits reach unprecedented heights.


What If Higher Risk Leads To Lower Returns?

Do you believe that taking riskier equity exposures should reward you with higher returns?

Most finance education is founded on the positive correlation between risk and reward. Taking incremental risk would not be worthwhile otherwise. Over the long run (past 10 and 20 years) global and regional equities have not fulfilled that expectation. In fact, the relationship between risk and realized reward appears to be the reverse of what was expected!

Riskier equities generated lower returns. This result is a two-handed slap in the face for anyone who still believes that markets are efficient. Despite the huge advantage of having excluded the perennial basket cases of Venezuela and Argentina (for most of the decade), the Latin American index rewarded investors with the highest volatility and negative annualized returns. A $100 investment in Latin America would have been whittled down to $87, after having suffered 28% annualized volatility and a worst drawdown of 61% that lasted 9 months.

Performance in EM equities and the Asia region was not much better. If you believe that long term equity returns should surpass that of Treasury bonds, you would have been extremely disappointed with equities as an asset class over the past decade.

Even the S&P 500's 8.5% annualized return is cold comfort when you consider that the Barcap 20+ year U.S. Treasury Index had a total return of 6.6%. The S&P 500's realized excess return of 1.9% (excluding tax effects) includes a worst drawdown period of 14 months when the index lost 48%. For those who might point to the superior drawdown management of active equity investors, many active managers performed even worse than that.

Maybe 10 years is too short a time period to consider buy-and-hold horizon returns. What does it look like over the past 20 years? This time, the news is better (but not good!) for the typical MBA curriculum – there is the barest hint that riskier markets generated slightly higher returns.

But the weakly positive slope here is not convincing. Although the next 10 to 20 year period may not have a similar outcome, the risk/return profile over the past 10 and 20 years should make the thoughtful investor rethink the relationship between risk and reward. Over the past 20 years, the realized equity risk premium for the S&P 500 was 0.20%. Yes, that's right: 20 basis points. In addition to the -48% drawdown experience during the Great Financial Crisis of 2008, the S&P also lost 45% during the early 2000s. I wouldn't fault anybody for thinking that buy-and-hold equity risk was not worth the heartache. Indeed, a retiree would have to have an almost religious faith that markets will rebound from such a loss. But after demonstrating such faith after the first 10% drawdown, then 20%, then 30%, at what point does faith dissolve in a pool of tears?

Changing our focus to markets operating in regions of highest economic growth, Asian equities returned 8.7% annualized over 20 years, only 1.5% better than the S&P 500, and 1.7% better than the Barcap 20+ year Treasury Index. During this period, Asian equities had two periods of horrendous drawdowns. The first occurred during the late 1990s, when the MSCI Asia ex-Japan Index incurred a 51% loss. During the Great Financial Crisis, it lost 61%.

And in case you wonder how risk vs. return looked over the past 5 years, here it is:

The negative correlation between risk and returns is extreme over the last 5 years.Adding insult to injury: the riskiest markets (Asia, EM, LatAm) benefitted from extreme outperformance in 2017. Asian equities gained 42%, EM gained 38%, and LatAm gained 24%. Such "lottery ticket" type gains may explain global investors' continued interest in these markets as buy-and-hold investments despite their poor long term track record, extreme volatility, inferior drawdown characteristics, and sub-standard corporate governance.

Those who object that volatility is a poor proxy for risk are correct. Worst drawdowns (i.e. losses from a previous high) are more important for most asset allocators and retirees.Here's a chart showing returns vs. risk, as quantified by worst drawdown. The strongly negative slope in the relationship between returns and risk should, again, cause long term investors to question what they're getting per unit of "risk" in these markets, especially when they are on the buy-and-hold bandwagon.

These observations may be of little interest to investors who are locked into a single equity silo (e.g. long only EM equity managers). However, for those with the freedom to hold other asset classes, the material may provide food for thought. Even for die-hard fans of the buy-and-hold philosophy, a nod toward asset dynamism was made by none other than Warren Buffett. He clarified in the 2016 Berkshire Hathaway shareholders' letter that he isn't a buy-and-hold investor where public equities are concerned.

The Dumb Money is Helping the Smart Money Exit the Stock Market


Bloomberg this week ran a story telling us how the smart money gets out of the stock market when it hits its all-time peak and how the dumb money helps the smart money out. Only they didn't know that was what they were writing. It typically happens this way:

At the end of a deliriously euphoric market rally when the market is preparing to crash, all the Joe Sixpacks, mom and pop and the family dog open trading accounts and try to chase the tail of market action. Many throw in their entire retirement funds, pawn the dog's collar and take out loans on credit cards to buy in as much as they can. By buying in late, they help provide a smooth exit for the smart money. At least for some of it. It is the little guys, tough from hard labor, whose muscles are employed to push the money bags of the rich to the top of the mountain from which the little guys are allowed to jump off.

That appears to be happening right now. While retail investment (at the mom-and-pop level) in stocks mushroomed last quarter, household debt also mushroomed, jumping at an annual rate of 5.2%, which is the fastest pace since …. 2007. (There is that comparison we keep finding in data everywhere.) Consumer credit rose at an annualized rate of 7.8%. Consumer credit-card debt just topped out at over a trillion dollars, and savings at the same time bottomed out to one of the lowest rates in history.

It's hard to say with certainty what all that debt all those savings were used for, but the change in both certainly matches the pace of growth in retail stock investments. (The S&P 500 rose 6.1% last quarter, with much of the new money pouring in from retail investors.) With no hard connection in those numbers at my immediate disposal, it would be a fallacy to claim them as proof that people are taking out credit card debt and depleting their savings to buy stocks, but that correlation certainly matches up with anecdotal accounts that many stock brokers are reporting at the street level.
All Trumped up and nowhere to go

Certainly the roar of mom and pop into retail stock investing is happening now …. big time, big league, in a hyuuuge way with the Donald's supporters being the ones who are rushing headlong in to provide the gold-bricked exit path for the 1%:


As 2017's roaring bull market gives way to a markedly choppier 2018, the buzz among Wall Street stock touts is that the best of the Trump Trade has passed…. Don't try to tell that to the true believers in San Angelo, Texas. Or Covington, Louisiana. Or Sioux Falls, South Dakota. They're sure this rally has just begun, and they're sure they know why. "I hear it every day," said Jimmy Freeman, a financial adviser at Edward Jones … east of the booming Permian Basin shale oil fields. "The market's going up because of Trump…."


Across middle America, in the towns big and small that voted overwhelmingly for Donald Trump, his most ardent, and financially comfortable, backers are opening stock-market accounts or beefing up existing ones, according to interviews with more than a dozen advisers and brokers. They were spurred on by a stream of presidential tweets crowing about, and taking credit for, the gains throughout 2017 and they remain undaunted now as the rally sputters and the tweeting dissipates. (Bloomberg)


Yes, the Trumpettes — by which I mean the little guys who supported the Donald because they were stomped all over by Bush and Obama — are now flooding into the market to provide the essential other side of the trade needed in every market sell-off — buyers. It's a market maxim that cannot have a market sell-off without a lot of buyers willing to leap for falling prices.


…From what financial advisers in conservative areas are seeing, there is a Trump-minted rush. Clients … at Concho Investment Advisors in San Angelo "are now more inclined to invest into riskier assets like the stock market" … and many cite the president. Todd Neff, for one, has put $400,000 into stocks since Trump's election. Before, he wasn't much of an investor, basically topping out his out his 401(k) and dabbling in shares here and there. A sheep breeder and small-business owner in San Angelo, he said he would have "dropped back big time" if Hillary Clinton had won. Consumers' confidence in the stock market soared to a record high in January before fading in February…. Among Trump's fans, though, trust in the firebrand politician as a stock-market bulwark easily endured the selloff
Share buybacks surging

That's one side of how the smart money gets out at the last minute and winds up richer thane ver: they are helped by the good-meaning people who hope to get a last piece of the action — this time from the champion they elected and believe in. The other side is orchestrated by the executive rats who flee their own sinking, stinking corporate stocks by using the company money to buy back their own shares. That's the bigger action. And that appears to be happening on steroids right now, too.

As the stock market roars toward its triumphant collapse, you hear the big-name analysts talking about how stocks are not overvalued because "earnings are doing great. They've never been better." What they usually mean is earnings per share, and what is really doing better in that fraction is the denominator. The number of shares is shrinking as corporate boards make decisions to drain the company coffers in order to buy back shares … often from themselves … sometimes even in special deals offered only to themselves off the general market (as I've reported in the past).

Buybacks have a double edge of cutting power. First, they cut the number of shares over which earnings are divided, making "earnings" look stronger; but secondly, they create their own market demand. Increasing demand = increasing price:


Over the past decade, there has been no corporate instrument of mistruth more powerful than buybacks, an issue we have dissected in these pages for years. U.S. firms have spent roughly $4 trillion on buybacks since 2009, making corporations the biggest single source of demand for U.S. shares…. Buybacks have "accounted for +40% of the total earnings-per-share growth since 2009, and an astounding +72% of the earnings growth since 2012. (13D Research)

What better plan could there be for the smart money, which owns the major shares, to exit the market without crashing the value of their own shares than by creating demand from within the company the smart money governs to buy shares in numbers equal or greater to all those the major investors wish to sell? (Major investors being the ones who sit on the board or hold executive positions.)

Thanks to Trump's new tax law encouraging repatriation of cash that has been stored overseas, companies are doing exactly what I and many others said they would do with their one-time tax savings on this mother load. No, they are not using it to invest in their own companies as proponents of the plan promised, and as I predicted they would NOT do. They are using their overseas cash stockpiles buy back stocks.


Buybacks are already on record pace — $171 billion worth have been announced so far in 2018, more than double the amount disclosed by mid-February 2017. If a tax-bill-fueled buyback bonanza can effectively "buy the dips", market tranquility can be protected, preventing a large-scale unwinding.

In fact, the first six weeks of announced buybacks this year already was higher than the entirety of 2009. JP Morgan projects that, at this rate, S&P 500 companies will by back a record $800 billion in stocks in 2018. JP noted that large accelerations in buybacks like this tend to happen during market selloffs and for that reason says that buybacks could go higher than $800 billion this year if they rise to the level seen right at the end of the last business cycle where companies returned more than 100% of profits to shareholders.

These enormous buybacks are the only action saving the market right now from crashing. The Trump cash cache came through just in time to offset the initial stages of the Fed's quantitative tightening. Of course, that was also my basis for predicting that the market would likely plunge in January but that this wouldn't be the big collapse … not yet.

That collapse, I maintained, will come in the summer when much of the cash repatriation is winding down, just as the Fed is stepping its own unwind up to third gear. At about that point this year, the Fed's reduction of its balance sheet and the effect of rising interest rates could outstrip the pace of buybacks and other benefits the market gets from the new tax plan. So, that's the basis for my giving that timing.

Analysts estimate $200 billion in buybacks from cash repatriation and $100 billion in buybacks funded by tax savings. I see the $450 billion in Fed bond sell-offs as playing against that flood of investments by raising interest on bonds. If JP Morgan's prediction of $800 billion in buybacks is right, then I'll be wrong about the Fed taking the wind out of the stock market and the general economy that soon; but I think rising interest will turn back the flood tide of buybacks later in the year by stripping away their easy funding, so that they wind up not happening in the big numbers that are being projected. (There is a dynamic involved that I think those who are promising the buybacks are not seeing.)

David Stockman sees it and projects the current buyback rate would hit even higher than JP does — at a record $1 trillion this year — except that, like me, Stockman doesn't see the current rate as being sustainable.


To be sure, we don't believe they will ever get there because the bond "yield shock" is going to be sobering up corporate boards right soon. (TalkMarkets)

I agree. As you can deduct from the following graph, much of the buyback action during the so-called "recovery" period was financed from debt (largely corporate bonds) prior to the Trump's tax changes:


Buyback happen the most right at the market's peak as the market tries to sell off to try to delay the sell off (so the smart money can get out), but then fall off quickly with the market once all hope is gone.

The drainage of the bulk of Trump's tax benefits that is now running straight into the buyback pit (as I predicted it would) is already causing a backlash among politicians as they learn what nonsense the talk was of using that money to develop businesses, build new plants, develop new products and … the biggest lie of all, boost wages. Some of us pay attention to history — learn from it — so knew from the beginning that those promised were completely bogus.


Since passage, total buybacks announced exceed worker bonuses and raises by roughly 63x.

Yes, the dollars spent on buybacks is only 6,300% more than the bonuses and wage boosts that have been announced. And who benefits from all of that?

The smart money.

The CEOs and other top managers who receive much of their compensation over the years in stock options and the board members and other shareholders in the company. But, hey, if you got your thousand-dollar bonus, what is to complain about, right? That ain't crumbs.

Well, not to you maybe, but it is mere dust under the table compared to what the shareholders are getting. God rest their merry souls … hopefully for a very long time.

The nice thing (for them) is they are also able to use that repatriated money and their corporate tax savings to bail themselves out of all that debt they used in preceding years when interest was cheap to drive their stock prices up:


According to an IMF estimate from last spring: "Large U.S. corporations have experienced a negative net equity issuance of $3 trillion since 2009 due to share buybacks." U.S. corporate debt — piled on by both strong and weak hands — sits at an all-time high of $13.7 trillion.

If they want to. Or they can just jump ship and leave the corporation buried in debt. What do they care if they sell their shares first?


Meanwhile, the tax bill will disproportionately benefit the strong hands — for one, the richest 10% of companies control 80% of the $1 trillion offshore cash hoard.

Uh huh.


Since 2009, the largest equity drawdowns — August 2015, January to February 2016, and two weeks ago — all occurred in or right after the share buyback blackout period. Even less surprising, corporations stepped in after February 5, 2018, bought the dip, and suppressed volatility. Goldman Sachs' unit that executes share buybacks for clients had its busiest week ever, seeing roughly 4.5x its average daily volume over 2017.

Uh huh.

That's where I said the vast majority of the repatriated money would go.


Share buybacks are a major contributor to the low volatility regime because a large price insensitive buyer is always ready to purchase the market on weakness.

Those companies that don't have the free cash that the top 10% of companies have will not be able to keep inflating their stock values against downward market forces, and will be the first to start sliding away, taking more and more of the market with them over time.

Said Moody's in the article referenced above,


High quality companies will benefit but low-quality levered companies could get hit hard.

The highly levered companies that used debt to do buybacks during the "recovery," are most likely not the companies with cash stockpiles overseas that can now be repatriated cheaply. Now, that interest rates are rising, they will get caught in a debt trap and hammered badly.
So, where we go over the Niagara falls of debt … again


Because assets are bundled, it may take dangerously long to identify a toxic asset. And once toxicity is identified, the average investor may not be able to differentiate between healthy and infected ETFs. (A similar problem exacerbated market volatility during the subprime mortgage crisis a decade ago.) As Noah Smith writes, this could create a liquidity crisis: "Liquidity in the ETF market might suddenly dry up, as everyone tries to figure out which ETFs have lots of junk and which ones don't."

Been there, done that, learned nothing.

Did you know that buybacks used to be illegal in the United States because regulators feared corporate boards would use them to manipulate the prices of their own shares?

Go figure, huh? What a dumb idea! Nobody would do that, so let's deregulate it!

That buyback regulation that was removed is now an area of law Democrats are focusing in on for the mid-term election cycle. If the law reverts to ending buybacks, the low-volatility regime ends with it. But don't worry. If the Dem's don't get elected in sufficient numbers to reinstate that regulation, rising interest rates will accomplish the job anyway as soon as that hoard of repatriated cash runs out. You can only dam against the tide so long before market forces have their way.
The exodus is underway

So, that's how the smart money gets out of the stock market, leaving their ultimately devalued stocks in the hands of the dumb money.

As the Financial Times humorously noted,


Flush with cash after the Republican tax cuts, Cisco announced on Wednesday that it was building gleaming factories across the US, employing hundreds of thousands of workers to make the latest cutting-edge routers…. Sorry, of course not. The money is going back to shareholders.

Yeah. That's the way the real world works these days. Sorry wage earners. You get the crumbs after all.