MARKET FLASH:

"It seems the donkey is laughing, but he instead is braying (l'asino sembra ridere ma in realtà raglia)": si veda sotto "1927-1933: Pompous Prognosticators" per avere la conferma che la storia non si ripete ma fà la rima.


venerdì 16 febbraio 2018

“Financial Stress” Spikes. Markets, Long in Denial, Suddenly Grapple with New Era

Fed's monetary policy shift is finally taking hold. It just took a while.

The weekly St. Louis Fed Financial Stress index, released today,
just spiked beautifully. It had been at historic lows back in November,
an expression of ultra-loose financial conditions in the US economy,
dominated by risk-blind investors chasing any kind of yield with a passion,
which resulted in minuscule risk premiums for investors and ultra-low
borrowing costs even for even junk-rated borrows. The index ticked
since then, but in the latest week, ended February 9, something 
happened:
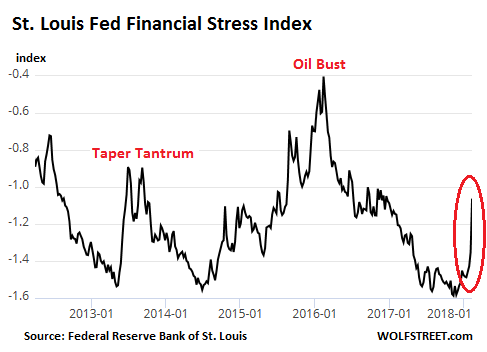

The index, which is made up of 18 components (seven interest
rate measures, six yield spreads, and five other indices) had 
hit a historic low of -1.6 on November 3, 2017, even as the
Fed had been raising its target range for the federal funds
rate and had started the QE Unwind. It began ticking up late last
year, hit -1.35 a week ago, and now spiked to -1.06.

The chart above shows the spike of the latest week in relationship
to the two-year Oil Bust that saw credit freeze up for junk-rated
energy companies, with the average yield of CCC-or-below-rated 
junk bonds soaring to over 20%. Given the size of oil-and-gas 
sector debt, energy credits had a large impact on the overall average.

The chart also compares today's spike to the "Taper Tantrum" in the
bond market in 2014 after the Fed suggested that it might actually
taper "QE Infinity," as it had come to be called, out of existence.
This caused yields and risk premiums to spike, as shown by the 
Financial Stress index.

This time, it's the other way around: The Fed has been raising rates
like clockwork, and its QE Unwind is accelerating, but for months markets 
blithely ignored it. Until suddenly they didn't.

This reaction is visible in the 10-year Treasury yield, which had been
declining for much of last year, despite the Fed's rate hikes, only to
surge late in the year and so far this year.

It's also visible in the stock market, which suddenly experienced a
dramatic bout of volatility and a breathless drop from record highs.
And it is now visible in other measures, including junk-bond yields
that suddenly began surging from historic low levels.

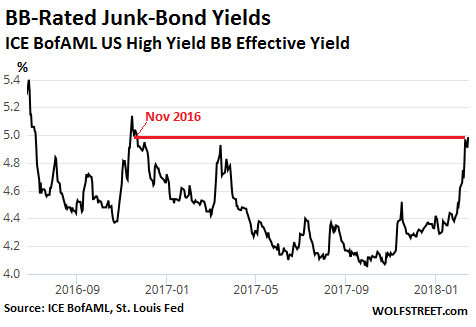
The chart of the ICE BofAML US High Yield BB Effective Yield Index,
via the St. Louis Fed, shows how the average yield of BB-rated
junk bonds surged from around 4.05% last September to 4.98%
now, the highest since November 20, 2016:

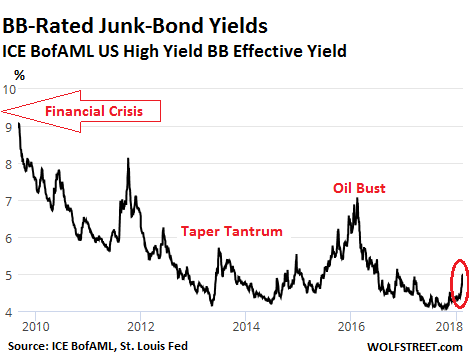
But a longer-term chart shows just how low the BB-yield still
is compared to where it had been in the years after the
Financial Crisis, and how much more of a trajectory it might 
have ahead:

When yields rise, it means that bond prices are dropping. And 
so the selloff that has been hitting the Treasury market is finally
creeping into the riskier parts of the corporate bond market,
which had been in denial of the Fed's efforts to tighten financial 
conditions via rate hikes and the QE Unwind.

The Financial Stress Index is designed to show a level of zero
for "normal" financial conditions. When these conditions are easy
and when there is less financial stress than normal, the index is
negative. The index turns positive when financial conditions are
tighter than normal.

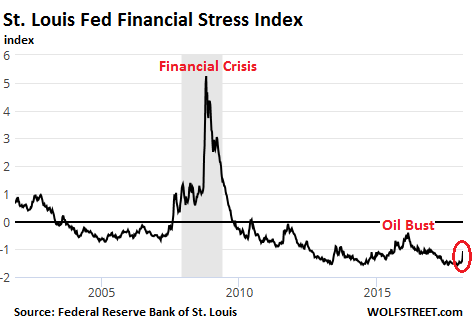
But at -1.06, it remains below zero. In other words,
financial conditions remain extraordinarily easy. This is clear
in a long-term chart of the index that barely shows the recent spike,
given the magnitude of prior moves:

This is precisely what the Fed wants to accomplish. The market is
just slow in reacting to a shift in monetary policies. But when
it begins to react, the adjustment can be sudden and large. Given
that the Fed wants to "normalize" financial conditions – where
these kinds of measures return to normal levels – there will have
to be quite a bit more tightening in the markets before the market 
catches up with the Fed's intentions. And the Fed itself is likely 
behind the curve – in which case it too will have to do some
catching up. So these adjustments in yields and prices are coming.
And yesterday's reports didn't help at all.

"Setting The Stage For A Broad Meltdown": Bond Funds See 5th Biggest Outflow On Record


Earlier this week, GMO's James Montier repeated verbatim  one of our recurring puzzling observations about the current market: while "a recent Bank of America ML survey showed the highest level of those citing "excessive valuation" ever. Yet despite this, the same survey showed fund managers to still be overweight in equities."  Back in August, we called this just one of the many bizarre market paradoxes observed in the market.
Here is another paradox.
As noted earlier, after last week's volocaust, this week was the best week for global stocks since 2011 as traders and algos furiously BTFD (and sold vol), clearly forgetting what happens when markets become too stretched, as they are becoming again.
It wasn't just stocks: junk bond yields dropped the most in three months, and CCC yields saw the biggest drop in more than five weeks yesterday amid what is reportedly buying flurry. As Bloomberg put it, "it was as if high yield investors were making up for the lost week" with HYCDX rising the most in 11 months, and junk bond ETFs, JNK and HYG, saw the biggest increase in three months.
As one would expected, junk spreads tightened across ratings.
And yet, despite surging prices, investors couldn't wait to get the hell out of credit amid the sudden repricing of inflation expectations which are certain to send yields higher (unless, of course, another wave of deflation emerges). In fact, BofA finds that last week saw the first simultaneous outflows from IG, HY and EM bond funds since the U.S. election.
According to BofA, which cited EPFR data, a whopping $14.1 billion was pulled from debt funds, with $10.9 billion taken from high-yield bonds alone, the second highest outflow on record.
Investment-grade bond funds also weren't spared, with $2 billion of redemptions ending a 59-week streak of inflows, BofA reported.
The iShares LQD Investment Grade Corporate Bond ETF posted a record one-day outflow Wednesday, the most among U.S.-listed passive vehicles across asset classes.
Separately, a report from Lipper confirmed the bond exodus, as investors pulled $6.3 billion from high yield bond funds for week ended Feb 14, the second biggest weekly outflow on record, and the fifth straight week of outflows, with the total over that period rising to $15 billion according to BloombergThe biggest outflow on record was $7.06b in August 2014.
Derivatives tied to corporate bonds moved more than the underlying cash debt last week - another sign that investors sold more liquid holdings during the equity turmoil rather than offload harder-to-sell debt, according to JPMorgan Chase & Co.
Which begs the question: if everyone is selling, how are yields lower and spreads tighter; i.e.who is buying?
"Investors don't sell their cash bonds in a big way until they are forced to, which happens when the outflows start picking up more sustainably," Morgan Stanley wrote this week.
Here are more details on fund flows:
First IG bond fund redemptions in 60 weeks ($2.0bn)
HY bond redemptions second highest on record ($10.9bn)
Largest EM debt outflows for 64 weeks ($2.9bn)

Modest muni fund outflows ($0.7bn)

Strong govt/Tsy fund inflows continue ($2.4bn)

Tiny TIPS inflows ($0.01bn)

Small bank loan fund outflows ($0.2bn)

Meanwhile, there was a similar paradox in stocks, where equities recovered from last week's record $30.6 bn in weekly outflows with $5.9bn in global inflows in the latest week, although US equity redemptions continued and saw $7.2 billion in money pulled after last week's record outflows.
The problem is that while equity vol tends to fade fast, a similar move in bonds or rates, could have far more troubling consequences: "The narrative is really becoming more about inflation and rate risk creeping into the broad markets," said Henry Peabody, a money manager at Eaton Vance Corp., with more than $400 billion of assets. "It's hard to think of elevated volatility in both rates and equity not eventually seeping into credit."
As Bloomberg writes:
These indicators may signal the tide is shifting. As recently as last week, corporate obligations outperformed -- anchored by long-term investors that stayed put while gauges of stock and rates volatility surged. Risk premiums on corporate bonds widened by a modest 10 basis points even as global stock indexes flashed bear-market signals.
As Morgan Stanley adds, "creeping corporate leverage is setting the stage for a broader market meltdown while higher real rates drive down asset values." Needless to say, Morgan Stanley projects negative returns for corporate bonds in the U.S., Europe and Asia in 2018. They warned that companies would struggle to refinance rising debt loads, just as rates rise and a tide of 'tourist' investors who'd dabbled in riskier debt abandon ship.
"It's a wake-up call that central banks are withdrawing liquidity, and that the process is not going to be smooth," the Morgan Stanley strategists wrote.
As for the punchline, we go to Federated Investors' trader Gene Neavin: "As the days of low inflation, low rates and low volatility are coming to an end, investors are realizing that the Fed party is over."
As usual, equities won't care until after the wake up call.

mercoledì 14 febbraio 2018

Englander: "If You Take Today's Data Literally, We Are At The End Of The Business Cycle"

If you take today's data literally we are at the end of the business cycle. Core inflation is picking up, the Fed's hand are tied, and demand seems to be slowing. The flattening of the yield curve suggests a inevitable sad ending, with the Fed unwilling and unable to provide stimulus and the US economy inexorably slows down. (For those of you who desperately need silver linings, it looks as the US savings rate is likely to be revised up.)

It is hard to read the inflation numbers as soft, despite all the noise in the components that pushed it up. So investors have to live with the view that price inflation may finally be moving up.

We would argue that the view of an impending business cycle end is wrong. If we are correct that retail sales provides a distorted view of activity then we are more likely to be in a 1994 scenario than a typical end of cycle. We don't expect anything like the Fed hawkishness of 1994, but the key point is that the economy did well and even equities were pretty stable, despite the rates move. In other words activity and Fed rate hikes can coexist peacefully. If that is the case, the business cycle is not doomed to fail soon. You may want to apply a higher discount factor to future equity earnings but you do not necessarily want to adjust the profits path sharply downward to reflect a cyclical downturn in profitability. In rates terms, the cycle end story is a flattener, the peaceful coexistence of tightening and activity is a steepener.


FX is more complicated -- my conjecture is that higher rates and end of cycle fears would doom USD. Higher rates, but the expansion carries on, is more ambiguous. The typical bond portfolio manager would be on a plane to Pyongyang, if North Korean bonds carried 50bps more risk-adjusted yield than Treasuries. The same logic would suggest that if Treasury yields are rising versus other DM economies, USD should be supported. Currently, I think the near-term USD outcome is clouded by investor concerns on fiscal expansion and the durability of the economic pickup. But if activity is sustained and the Fed tightening not so harsh, the current universal USD negative sentiment may be overturned. (I am attending a FX conference in Miami and dollar bulls are as rare as undrunk mararitas.)

Why we are skeptical on retails sales weakness 
Initial prints of retail sales tend to be low. Figure 1 shows three month averages the initial release of control retail and the most up-to-date estimate. (We use three month averages to smooth the data and make the differences more visible.) 

We suspect the weather played a big role in the retail sales weakness. Much of the US was historically cold in late December and early January. The cold snap began after the December payroll survey and pretty much finished before the January survey (although I think weekly hours may have been affected). Retail sales are based on whole month sales, if no one goes to the mall when it is freezing outside. 
Consider my US counterpart to the Li Keqiang index. It is a geometric average of the overall ISM manufacturing and non-manufacturing indices and the NFIB small business survey. We use both the headline and the employment components so there are six elements of the index. (The characteristic of a geometric index is that each component has the same weight at all points in time. We damp down the impact of the NFIB employment component by adding 100 to the published level.) 
The advantage of surveys is that they look past weather related disruptions, anticipating that things will go back to normal when the weather improves. 

Comparing the 'Englander' activity index with retail sales shows that the survey based indicator is much less erratic, has accelerated sharply and is close to 20 year highs -- all in contrast to the indications from retail sales. 


Arithmetically, the retail data are likely to lead to sharply revised down GDP numbers, although that does not look plausible given the survey data. We would go with the surveys.

Big Reset Looms for Corporate Credit Market

Market still blows off Fed, Treasury selloff, and volatility in stocks.

"Leveraged loans," extended to junk-rated and highly leveraged
companies,are too risky for banks to keep on their books. Banks
sell them to loan mutual funds, or they slice-and-dice them into
structured Collateralized Loan Obligations (CLOs) and
sell them to institutional investors. This way,the banks get 
the rich fees but slough off the risk to investors, such as
asset managers and pension funds.

This has turned into a booming market. Issuance has soared. And
given the pandemic chase for yield, the risk premium that investors
are demanding to buy the highest rated "tranches" of these CLOs has
dropped to the lowest since the Financial Crisis.

Mass Mutual's investment subsidiary, Barings, has packaged leveraged
loans into a $517-million CLO that is sold in "tranches" of different risk levels.
The least risky tranche is rated AAA. Barings is now selling the
AAA-rated tranche to investors priced at a premium of just 99 basis
points (0.99 percentage points) over Libor, according to S&P Capital,
cited by the Financial Times.

Also this week, New York Life is selling the top-rated tranche of a CLO
at a spread of less than 100 basis over Libor. And Palmer Square Asset
Management sold a $510-million CLO at a similar premium over Libor.

In the secondary markets, where the CLOs are trading, red-hot demand
has already pushed spreads below 100 basis points. These are the
lowest risk premiums over Libor since the Financial Crisis.

These floating-rate CLOs are attractive to asset managers in an
environment of rising interest rates. If rates rise further, Libor rises
in tandem, and investors would be protected against rising rates by
the Libor-plus feature of the yields.

Libor has surged in near-parallel with the US three-month Treasury
yield and on Monday reached 1.83%. So the yield of Barings CLO
was 2.82%. While the Libor-plus structure compensates investors
for the risk of rising yields and inflation, it does not compensate 
investors for credit risk!

These low risk premiums over Libor are part of what constitutes
the "financial conditions" that the Fed has been trying to tighten
by raising its target range for the federal funds rate and by unwinding
QE. It's supposed to make borrowing a little harder and a little more
costly in order to cool off the credit party.

One of the measures that track whether "financial conditions" are
getting "easier" or tighter is the weekly St. Louis Fed Financial
Stress Index. In this index, zero represents "normal." A
negative number indicates that financial conditions are easier
than "normal"; a positive number indicates that they're tighter than
"normal."

The index, which is made up of 18 components – including six
yield spreads, including one based on the 3-month Libor – had
dropped to a historic low of -1.6 on November 3, 2017. Despite
the Fed's rate hikes and the accelerating QE Unwind, it has
since ticked up only a smidgen and remains firmly in negative
territory, at -1.35.

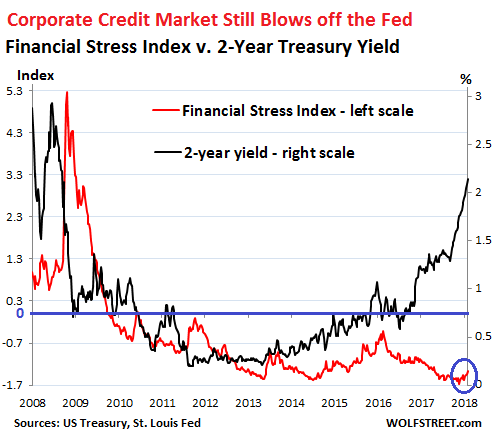
The Financial Stress Index and the two-year Treasury yield usually
move roughly in parallel. But since July 2016, about the time the
Fed stopped flip-flopping on rate hikes, the two-year yield began
rising and more recently spiking, while the Financial Stress Index 
initially fell.

The chart below shows this disconnect between the St. Louis 
Fed's Financial Stress Index (red, left scale) and the two-year
Treasury yield (black, right scale). Note the tiny rise of the red
line over the past few weeks (circled in blue):


The horizontal blue line marks zero of the Financial Stress
Index (left scale). At or above zero is where I — after 
reading the tea leaves — think the Fed would like to
see the index at this point. But the index is far from it.
And the CLOs mentioned above are examples of just how
ebullient corporate credit markets still are at every level.
A similar ebullience is still visible in junk bonds as well.

The corporate credit markets are starting to take into
account the risk of slightly higher inflation – hence the
appetite for these floating-rate CLOs. But the risk
premium over Libor and other risk premiums show
that credit markets are still totally in denial about 
the bigger risk for junk-rated credits: the risk of default.
And this risk of default surges when rates rise and 
financial conditions tighten as these companies have
trouble refinancing their debts when they come due.
But for now, investors are blithely ignoring that they're
in for a big reset.

The chorus for more rate hikes is getting louder. But
no one will be ready for those mortgage rates.

Conspiracy "Fact" - VIX Manipulation Runs The Entire Market

Ever since Simon Potter's 2012 arrival as head of The NYFed's trading desk, the manipulation of VIX (and thus its reflexive levered tail wagging the algo-driven dog of the indices) has been front-and-center day-after-day in the so-called US equity 'market'. Since the introduction of VIX ETFs there has been an almost inexhaustible supply of conspiracy theory coincidental evidence of a mysteriously well-capitalized market participant always willing to step on the neck of any volatility-spike, thus protecting poor market participants from any prospective plunge. While only fringe-blogs have noticed this in the past, now The FT admits that not only was recent volatility in markets exacerbated by VIX ETFs (thus confirming the tail-wagging-dog analogy), and further, the nature of the link between VIX ETFs and VIX Futures (rebalancing) enables frontrunning which serves to reinforce any trend into the close and thus manipulate the markets.

Since Simon Potter's arrival at The NY Fed in 2012... the rather amusing correlation between the collapse in net VIX futures non-commercial spec interest (yes, the traded VIX, which courtesy of the New Normal's relentless synthetic reflexivity has a huge impact on the trillions in underlying assets: think massive leverage) as per the CFTC's weekly commitment of tradersreport, and the arrival of Brian Sack's replacement as head of the NY Fed's trading desk, Simon Potter, the same former UCLA Econ PhD who recently delivered a very ornate speech explaining central bank interactions with financial markets "through the prism of an economist." Now at least we know how said "interactions" look outside of "Market Manipulation for Econ PhD Dummies" and in practice.


So-called VIX-terminations have bcome ubiquitous...

VIXtermination: Vol Banged To Lowest Close Since June 2007
VIXterminated - Fear Collapses By Most In 31 Months
Mickey Mouse Market Pops-n-Drops As Crude Carnage Follows VIXtermination
Volumeless VIXtermination Fuels Stock-Buying Frenzy To Record Highs
Biggest Short Squeeze Since 2008 Bank Bailout And Epic VIX Rigging Sends Stocks Green For The Week

Which all look - to some extent - like this...

VIX ETFs were screwed with...

To ensure S&P closed Green!!!


And notice the noise in VIX from this week...


But, this ability to exaggerate the upside of any momentum, has its downside.

As The FT reports, the upsurge in stock market turmoil during August was exacerbated by specialised exchange traded funds that track volatility and use leverage to magnify investor returns,according to some analysts.

Some analysts argue that the magnitude of the move in the Vix was fuelled by certain types of ETFs, and similar exchange traded notes, that track the index but use futures contracts to multiply investor's returns.

There is rising concern over the bigger role played by passive or systematic trading strategies in equity markets — given the current uncertain global economic and financial backdrop — with some fund managers arguing that their techniques are aggravating market movements.

Four products, two run by ProShares and two run by VelocityShares, totalling $2.8bn in assets, bought close to 35,000 Vix futures contracts on August 24, according to calculations from public data by Macro Risk Advisors, a broker dealer. Total trading volume in the futures contracts that day reached 569,000.

Which explains the unprecedented record net longs in VIX Futures...

Speculative traders have never - ever - been this net long VIX futures... and traders have not been this net short S&P futures since Summer 2012.


It's all great when VIX is getting smashed lower - and implicitly stocks surged higher - but it appears the only "volatility" that gets any real attention is "downside" moves...

"It exacerbated the move higher in the Vix, and has contributed to high volatility in the Vix itself," said Pravit Chintawongvanich, a strategist at MRA. "Volatility of Vix at one point reached 2008 levels. The effect of levered ETFs is one reason that the Vix is less useful as a barometer of financial stress than in the past."

BlackRock, the largest mutual fund in the world, has previously warned about the risks of levered ETFs, and in a policy paper in July reiterated recommendations, "that these products not use the ETF label".

And the manipulation is simple and cost-effective...

Futures contracts only require a small amount of money, or "margin", to be paid up front to cover potential losses, rather than having to pay the full amount of the investment, allowing an ETF to buy a larger value of futures contracts than investors have paid into the fund.

For example, investing $100 in an ETF offering twice the returns of the Vix futures index will mean the ETF provider buys $200 worth of futures. If the price goes up 10 per cent then the investor receives 20 per cent back, or $20. The investment is now worth $120 and the ETF is worth $220, so at the end of the day it has to go out and buy another $20 worth of futures contracts to maintain the same leverage for the next day.

But here is the potential for froint-running and manipulation (especially from a deep-pocketed vol seller)...

It requires ETF providers to buy as prices rise and sell as prices fall, which critics claim exacerbates market movements, filtering back into the closely-related options markets that the Vix is priced from.

But providers of levered volatility products played down the relationship.

"There is a layer of separation between the Vix and Vix futures, and the ability to uncover any effect is challenging," said Scott Weiner, head of ETP quantitative strategy at Janus Capital, which own VelocityShares. "It's a small impact, if at all."

The CBOE, which runs the Vix index, said that it allows investors, including ETFs, to agree trades during the day where the price is determined by the settlement price of a contract once the market closes, allowing ETFs to rebalance without having a significant impact on the price... and critics say this does not work...

because the amount ETFs need to rebalance each day is publicly disclosed. "If people know someone has to buy in large size at the end of the day, then they will simply buy the contracts ahead of them," said Mr Chintawongvanich. "It has the same effect."

So, whether by direct manipulation (sparking the most modest of momentum knowing that VIX ETF rebalancing into the close will extend any move), or learned rigging by the algos(following the same pattern), it appears yet another conspiracy theory become conspiracy fact.

* * *

But there is a silver lining to the recent smashing of fingers trapped trying to pick up pennies in front of steamroller...it appears The VIX Manipulation has begun to lose its mojo...

A 1.5 vol crush in VIX managed a mere 6 point rise in the S&P 500 (20% of what would have been expected!!)


Warning: The Fed will "Let Stocks Go.", but not now.....

The Fed will "let the stock market go." As I've outlined multiple times, if the Fed has to choose between supporting the bond bubble or supporting stocks, it will choose bonds Every. Single. Time. The fact is that in a debt-saturated world such as the one we live in today, if stocks collapse, investors and Wall Street get angry. If bonds collapse, entire countries go bust.

Cue NY Fed President Bill Dudley last week:

Judging by remarks this week from policy makers, who were unmoved by rising yields and the losses in stocks, the Powell Fed isn't rushing to signal that tendency. New York Fed President William Dudley on Thursday called the stock selloff "small potatoes" and said it has no economic implications.

Source: Bloomberg

This is Bill Dudley talking… the guy who was pushing for more QE non-stop and who routinely appeared to verbally "prop up" the markets anytime they took a nose-dive from 2008-2016.

And now he's calling last week's sell-off "small potatoes." And he's ALSO saying that the Fed believes the markets could dive without impacting the economy in any significant way.

Renaissance Tumbles Despite Correctly Predicting Market Correction

Things have sure been strange in the world of hedge funds lately.

Take Bridgewater, whose founder on January 23 was mocking cautious investors everywhere saying "we are in this Goldilocks period right now. Inflation isn't a problem. Growth is good, everything is pretty good with a big jolt of stimulation coming from changes in tax laws. If you're holding cash, you're going to feel pretty stupid."

It has since emerged that during this exact time, Bridgewater was building - and continues to build - a massive short position against European corporations which is now fast approaching $15 billion and includes such giants as Deutsche Bank, Siemens and Total.Meanwhile, after warning that the "we'll probably have a much bigger shakeout coming"over the weekend, on Monday a contrite Ray Dalio admitted that he was wrong to mock thosehodling cash, and explained the reason for his bearishness - and hypocrisy - stating in a LinkedIn post that everything "had changed" in the ten days since the Payrolls report, with inflation suddenly a far greater risk.

Of course, that does not explain why Bridgewater was already bearish and was alreadybuilding what is shaping up to be the hedge fund's largest thematic short in history.

End result: the world's largest hedge fund made a substantial paper profit on the short side thanks to its multi billion European short (that's the only short the fund is required to disclose, so one can only speculate where else it may be shorting).

Now take that "other" hedge fund, quant giant Renaissance Technologies (also known as the "Puppetmaster Behind The US Presidential Election"). Unlike a mocking Dalio, in January, RenTec's head of risk control, Ed Hubner, penned a letter issuing a red alert to investors in RenTec's public-facing Institutional Equities Fund, RIEF, warning them to brace for "possible market turbulence" and the "significant risk" of a correction, and that while accelerating global growth, corporate tax reform and a business-friendly administration in the U.S. have contributed to market gains, "it's not clear these factors justify current valuations, especially in light of sovereign debt levels."

Further, in a surprisingly accurate preview of things to come just days later, Hubner warned that "the downward technical pressure on the VIX, due to the growth of strategies that bet against market volatility, and lower correlations within the S&P 500, shouldn't be confused with unshakable economic calm."

On Monday 5, the day of the volocaust, the world understood precisely what he meant.

And yet, while RenTec was dispensing with warnings, it refused to put its - and its investors' money - where its mouth was. In fact, as Bloomberg reports, the hedge fund that in January warned clients of a "significant risk" of a correction, lost 5.4% this month through Feb. 9, as a result of the correction it correctly predicted would happen.

Since Jan. 1, the Renaissance Institutional Equities Fund is down 3.4 percent, according to an investor document seen by Bloomberg News. Known as RIEF, the strategy trades only U.S.-listed equities and is biased toward stocks that Renaissance's models expect to rise. It's designed to outperform the S&P 500 Index by 4 to 6 percentage points and managed about $22 billion as of the end of last year.

So to summarize: Bridgewater mocks market skeptics as it covertly builds a major short bet, and then - to much fanfare - announces that its bullishness was misplaced, and that the business cycle is much further along that it had expected... meanwhile RenTec warns there is a "significant risk" of a market correction, that market correction hits just days later, and the result is a major hit for RenTec which, just like Dalio, refused to practice what it was preaching, and immediately suffered the consequences.


Moral of the story: at any and every opportunity, hedge funds will lie to you, and the bigger the hedge fund, the bigger the lie.

The Fed's Impossible Choice, In Three Charts

Critics of "New Age" monetary policy have been predicting that central banks would eventually run out of ways to trick people into borrowing money.


There are at least three reasons to wonder if that time has finally come:
Wage inflation is accelerating

Normally, towards the end of a cycle companies have trouble finding enough workers to keep up with their rising sales. So they start paying new hires more generously. This ignites "wage inflation," which is one of the signals central banks use to decide when to start raising interest rates. The following chart shows a big jump in wages in the second half of 2017. And that's before all those $1,000 bonuses that companies have lately been handing out in response to lower corporate taxes. So it's a safe bet that wage inflation will accelerate during the first half of 2018.

The conclusion: It's time for higher interest rates.
The financial markets are flaking out

The past week was one for the record books, as bonds (both junk and sovereign) and stocks tanked pretty much everywhere while exotic volatility-based funds imploded. It was bad in the US but worse in Asia, where major Chinese markets fell by nearly 10% — an absolutely epic decline for a single week.


Normally (i.e., since the 1990s) this kind of sharp market break would lead the world's central banks to cut interest rates and buy financial assets with newly-created currency. Why? Because after engineering the greatest debt binge in human history, the monetary authorities suspect that even a garden-variety 20% drop in equity prices might destabilize the whole system, and so can't allow that to happen.

The conclusion: Central banks have to cut rates and ramp up asset purchases, and quickly, before things spin out of control.

So – as their critics predicted – central banks are in a box of their own making. If they don't raise rates inflation will start to run wild, but if they don't cut rates the financial markets might collapse, threatening the world as we know it.
There's not enough ammo in any event

Another reason why central banks raise rates is to gain the ability to turn around and cut rates to counter the next downturn.

But in this cycle central banks were so traumatized by the near-death experience of the Great Recession that they hesitated to raise rates even as the recovery stretched into its eighth year and inflation started to revive. The Fed, in fact, is among the small handful of central banks that have raised rates at all. And as the next chart illustrates, it's only done a little. Note that in the previous two cycles, the Fed Funds rate rose to more than 5%, giving the Fed the ability to cut rates aggressively to stimulate new borrowing. But – if the recent stock and bond market turmoil signals an end to this cycle – today's Fed can only cut a couple of percentage points before hitting zero, which won't make much of a dent in the angst that normally dominates the markets' psyche in downturns.

Most other central banks, meanwhile, are still at or below zero. In a global downturn they'll have to go sharply negative.


So here's a scenario for the next few years: Central banks focus on the "real" economy of wages and raw material prices and (soaring) government deficits for a little while longer and either maintain current rates or raise them slightly. This reassures no one, bond yields continue to rise, stock markets grow increasingly volatile, and something – another week like the last one, for instance – happens to force central banks to choose a side.

They of course choose to let inflation run in order to prevent a stock market crash. They cut rates into negative territory around the world and restart or ramp up QE programs.

And it occurs to everyone all at once that negative-yielding paper is a terrible deal compared to real assets that generate positive cash flow (like resource stocks and a handful of other favored sectors like defense) – or sound forms of money like gold and silver that can't be inflated away.

The private sector sells its bonds to the only entities willing to buy them – central banks – forcing the latter to create a tsunami of new currency, which sends fiat currencies on a one-way ride towards their intrinsic value. Gold and silver (and maybe bitcoin) soar as everyone falls in sudden love with safe havens.

And the experiment ends, as it always had to, in chaos.


martedì 13 febbraio 2018

Nomura: "This Was The Moment When Everything Changed"

THE MOMENT WHEN EVERYTHING CHANGED

For the "right" reasons, the market continues to focus on tomorrow's US CPI print, which will act as a referendum on the merit of the fixed-income repricing experienced since the start of December. As stated previously, the list of 'bearish catalysts' for fixed-income is long and illustrious:

above-trend global growth

percolating US inflation and wages (i.e. last week's AHE print)

real-time US fiscal stimulus via tax reform (with further wage implications)

US 'deficit spending' requiring massive Treasury refunding needs in 2018 (running nearly 2x's 2017)

particulars of the aforementioned tax reform, which will disincentivize US mega-corporates from 'parking' offshore cash in UST-instruments and credits, and instead likely force them to pivot to turning net sellers in coming months and years.

In hindsight, the 'tie-breaker' which drove UST 10Y yields out of their multi-month 2.35-2.50 range into this new stratosphere looks to have been the US fiscal stimulus / tax reform plan passing the initial Senate vote on December 2nd, 2017. 

By December 6th, the UST 10Y Term Premium had inflected from 1+ year lows (-62bps) and "hasn't looked back," +45bps to now just -17bps. Why? This was the point where the Fed's post-crisis playbook of "perpetually low nominal rates and flatter curves" was then deemed by the market as potentially "old news." Instead, the market appropriately determined that in light of the economic expansion, the growing likelihood of higher inflation, the coming refunding / supply wave etc that rate volatility now had to move higher, because the bond market was, going-forward, no longer going to be "controlled" entirely by the same "forward guidance" regime of the GFC period….as a new era of interest rate risk was deemed to be upon us.

As such, USD 3m10Y Swaption Vol printed all-time lows on Dec 13th, while the MOVE index (UST volatility) bottomed Dec 14th.


Also on Dec 14th, the Quant Insight "macro regime" model for UST 10Y—essentially the "explainability" of the price of the underlying asset based off the key macro factor factors--peaked at 86% before collapsing all the way down to just 5% "explainable" by January 12th. On Dec 14th, the Nomura FX Volatility Index put in a three year and a half year low ( since +65%). For US equities, the 12m forward PE Ratio peaked Dec 15th. By Dec 18th, Bitcoin also peaked at $18,674 ( since 'melted down' to the current $8465 level). Since Dec 5th (3 days after Senate passage of tax bill), UST 5Y breakevens have rallied 20bps, while Gold has rallied $87 / oz. The US Economic Surprise Index peaked Dec 22nd. I could go on and on….

Point here being that the uber-ambiguous "something has changed in the market" meme that's been going-around is based-upon the underlying change in perception with regard to a bond market that is waking from its slumber due to a new-found Central Bank willingness to normalize policy on account of actual signs of "growth" and "inflation"—ESPECIALLY after being "put over the top" by US fiscal stimulus. The above observations are simply the manifestations of this mentality-shift in the market….qualitative observation into quantitative phenomenon.


How to Manipulate Stocks: Chinese Authorities Step in to Stop the Rout


For proper effect, the directives were purposefully leaked to the media.

The Shanghai Composite Index plunged 10.2% last week, the largest 
weekly drop in two years, and was down 11.4% since January 26. But
it wasn't just last week that things became unglued. The Shenzhen 
Composite Index had plunged 14% since January 24, only about half 
of it last week.

The Spring Festival holiday is coming up this week, and there were 
fears that traders want to unload additional positions ahead of it. There
are other factors lined up against the stock market, including China's 
off-and-on-again crackdown on leverage. So it was time for authorities
to step in and set things right.

Over the weekend the China Securities Regulatory Commission (CSRC)
and other regulators have sent directives to:
Major stockholders, telling them to acquire more shares of companies
listed in mainland China in which they already own large stakes.
Mutual fund firms, telling them to curtail share sales to avoid becoming
net sellers.
Brokerages, telling them to provide to the CSRC trading summaries
from last week along with trading plans and previews for the current week.

For proper effect, so that all players in the market would know that the
Chinese authorities are going to stop the selloff and turn it around, and thus
to encourage more buying by other players, these directives were 
purposefully leaked to the media, including Bloomberg, which reported
it this morning. This served as confirmation what everyone had been
hoping for: That the authorities would not let the market fall prey to market forces.

The directives went out this weekend, but late last week there was already
some heavy lifting going on behind the scenes that wasn't properly leaked.
Bloomberg counted over 110 companies listed in Shanghai and Shenzhen
that had announced that their major shareholders had increased their stakes
in them starting on Friday.

Bloomberg also reported that the Shanghai Stock Exchange had announced
on Friday that it had issued warnings and limited intraday trading to prevent
large sales that might affect market stability.

After all this had gotten out by Monday morning, it was now time to keep
small investors from selling and to encourage them to buy more. The
Shanghai Securities News reported on Monday, according to Bloomberg,
that the China Securities Investment Services Center, which serves smaller
investors, said that major shareholders can boost investor confidence by
purchasing stocks.

Authorities are once again yanking on the levers to keep the market from
backsliding into some sort of price discovery. And it worked. The markets
in China were up on Monday, with the Shanghai Composite rising 0.8%
and the Shenzhen Composite surging 2.6%, which set the tone in Asia.
All major Asian markets showed gains, except in Japan where markets 
were closed due to the National Founding Day, one of the 16 market 
holidays of the year. So they missed out.

And it is calming the waters in the US. Well done. But then, why even
have markets? Why can't Chinese authorities just set the price of each
stock and make it go up at regular intervals, at a rate deemed to be
appropriate by authorities? It would offer true risk-free investing in stocks.
It could become a national wealth builder. The entire world would invest
in such a scheme. Think of the possibilities! And it would be a lot more
efficient than this haphazard guessing-and-manipulation game.

How can the media be so gullible?

S&P 500 Snapshot: More Declines, a Correction, and Market Sell-off

The S&P 500 continued its decline from last Friday, ending the tumultuous week with a loss of 5.16% from last Friday. This week saw a correction on Thursday, 10.16% off its high. The index is 8.82% off its record close.


The U.S. Treasury puts the closing yield on the 10-year note at 2.83%.

Here is a daily chart of the S&P 500. Today's selling puts the volume 62% above its 50-day moving average.


Here's a snapshot of the index going back to December 2008.

A Perspective on Drawdowns

Here's a snapshot of record highs and selloffs since the 2009 trough.


Here is a more conventional log-scale chart with drawdowns highlighted.


Here is a linear scale version of the same chart with the 50- and 200-day moving averages.

A Perspective on Volatility

For a sense of the correlation between the closing price and intraday volatility, the chart below overlays the S&P 500 since 2007 with the intraday price range. We've also included a 20-day moving average to help identify trends in volatility.