MARKET FLASH:

"It seems the donkey is laughing, but he instead is braying (l'asino sembra ridere ma in realtà raglia)": si veda sotto "1927-1933: Pompous Prognosticators" per avere la conferma che la storia non si ripete ma fà la rima.


sabato 27 gennaio 2018

Alan Greenspan Admits Ron Paul Was Right About Gold

In the next issue of The Austrian, David Gordon reviews Sebatian Mallaby's new book, The Man Who Knew, about the career of Alan Greenspan. Mallaby points out that prior to his career at the Fed, Greenspan exhibited a keen understanding of the gold standard and how free markets work. In spite of this contradiction, Mallaby takes a rather benign view toward Greenspan. 
However, in his review, Gordon asks the obvious question: If Greenspan knew all this so well, isn't it all the more worthy of condemnation that Greenspan then abandoned these ideas so readily to advance his career? 
Perhaps not surprisingly, now that his career at the Fed has ended, Old Greenspan — the one who defends free markets — has now returned. 
This reversion to his former self has been going on for several years, and Greenspan reiterates this fact yet again in a recent interview with Gold Investor magazine. Greenspan is now a fount of sound historical information about the historical gold standard: 
I view gold as the primary global currency. It is the only currency, along with silver, that does not require a counterparty signature. Gold, however, has always been far more valuable per ounce than silver. No one refuses gold as payment to discharge an obligation. Credit instruments and fiat currency depend on the credit worthiness of a counterparty. Gold, along with silver, is one of the only currencies that has an intrinsic value. It has always been that way. No one questions its value, and it has always been a valuable commodity, first coined in Asia Minor in 600 BC.
The gold standard was operating at its peak in the late 19th and early 20th centuries, a period of extraordinary global prosperity, characterised by firming productivity growth and very little inflation.
But today, there is a widespread view that the 19th century gold standard didn't work. I think that's like wearing the wrong size shoes and saying the shoes are uncomfortable! It wasn't the gold standard that failed; it was politics. World War I disabled the fixed exchange rate parities and no country wanted to be exposed to the humiliation of having a lesser exchange rate against the US dollar than itenjoyed in 1913.
Britain, for example, chose to return to the gold standard in 1925 at the same exchange rate it had in 1913 relative to the US dollar (US$4.86 per pound sterling). That was a monumental error by Winston Churchill, then Chancellor of the Exchequer. It induced a severe deflation for Britain in the late 1920s, and the Bank of England had to default in 1931. It wasn't the gold standard that wasn't functioning; it was these pre-war parities that didn't work. All wanted to return to pre-war exchange rate parities, which, given the different degree of war and economic destruction from country to country, rendered this desire, in general, wholly unrealistic.
Today, going back on to the gold standard would be perceived as an act of desperation. But if the gold standard were in place today we would not have reached the situation in which we now find ourselves.
Greenspan then says nice things about Paul Volcker's high-interest-rate policy: 
Paul Volcker was brought in as chairman of the Federal Reserve, and he raised the Federal Fund rate to 20% to stem the erosion [of the dollar's value during the inflationary 1970s]. It was a very destabilising period and by far the most effective monetary policy in the history of the Federal Reserve. I hope that we don't have to repeat that exercise to stabilise the system. But it remains an open question.
Ultimately, though, Greenspan claims that central-bank policy can be employed to largely imitate a gold standard:
When I was Chair of the Federal Reserve I used to testify before US Congressman Ron Paul, who was a very strong advocate of gold. We had some interesting discussions. I told him that US monetary policy tried to follow signals that a gold standard would have created. That is sound monetary policy even with a fiat currency. In that regard, I told him that even if we had gone back to the gold standard, policy would not have changed all that much.
This is a rather strange claim, however. It is impossible to know what signals a gold standard "would have" created in the absence of the current system of fiat currencies. It is, of course, impossible to recreate the global economy under a gold standard in an economy and guess how the system might be imitated in real life. This final explanation appears to be more the sort of thing that Greenspan tells himself so he can reconcile his behavior at the fed with what he knows about gold and markets. 
Nor does this really address Ron Paul's Concerns expressed for years toward Greenspan and his successors. Even if monetary policymakers were attempting to somehow replicate a gold-standard environment, Paul's criticism was always that the outcome of the current monetary regime can be shown to be dangerous for a variety of reasons. Among these problems are enormous debt loads and stagnating real incomes due to inflation. Moreover, thanks to Cantillon effects, monetarily-induced inflation has the worst impact on lower-income households. 
Even Greenspan admits this is the case with debt: "We would never have reached this position of extreme indebtedness were we on the gold standard, because the gold standard is a way of ensuring that fiscal policy never gets out of line."
Certainly, debt loads have taken off since Nixon closed the gold window in 1971, breaking the last link with gold: 

Stocks Storm To Best Start Since 1987 Amid Dollar-Devastation

After that week, we suspect more than a few FX traders feel the same way...


Let's get a little context before we start - this is the most overbought (by a bloody mile) that US equities have ever been...
And...98% of global equity markets trading above 50 & 200 day moving averages.
This is the best start to a year for the Dow and the S&P 500 since 1987...
While Nasdaq is 2018's big winner, this is only its best start to a year since 2004. S&P, Dow, & Nasdaq have only seen 4 down days in 2018
On a side note, China's H-share index broke its record daily streak this week, but...with its seventh week of gains, the Chinese index reaches its longest run of gains since October 2010.
Today was pure panic-buying euphoria...
On the week, Trannies suffered as Airlines crashed (Transports worst week in over 3 months)...
This is the 4th weekly gain in a row for the S&P 500, Dow, and Nasdaq (and 9th of the last 10 for Dow and S&P)
Having surpassed Goldman's 2018-Year-End Target of 2850, at 2863, the S&P becomes the 2nd largest US equity bull market of all-time, and BofA's Q1 target.
For a brief few panic-buying minutes there, NASDAQ actually went vertical on massive volume as the machines ran it up to 7500!!
A VIX Close above 11.27 for the week would be the 3rd week in a row of gains for both VIX and the S&P 500 (something that hasn't happened since Feb 2013 and has only happened 5 times in history before - always followed by equity weakness)...
Everyone's buying calls...
As the usually extremely high correlation between upside and downside implied volatility has collapsed...
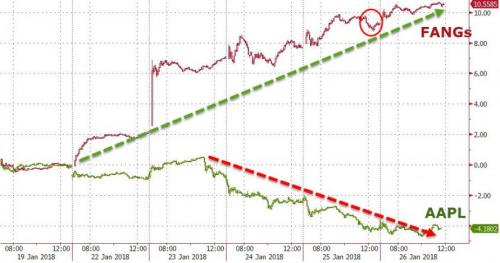
A stunning week for Tech with AAPL plunging and FANGs surging... (NOTE this is the biggest weekly divergence between the two since FANGs started trading - bigger than April 2016)
In FX Fantasy-land... Trump's Rescue Bid failed and the dollar pressed down towards cycle lows... (NOTE the dollar is down 7 weeks in a row - the longest streak since Aug 2010) The Mnuchin Massacre managed the worst week for the dollar in 8 months
One could be forgiven for thinking this is a Trump-driven dump...
This is the worst start to a year for the dollar since 1987...
And the ultimate correlation has broken...
Treasuries were very mixed on the week. Despite the bloodbath in the dollar, the Long Bond rallied (-2.25bps on the week) as 2Y yields spiked almost 6bps...
10Y Yields bumped up against 2.67% three times and rallied lower in yield each time...
And the yield curve continued to crater... today is the first time that the 2s30s spread has closed below 80bps since Oct 16th 2007...
Away from the Dollar Index, today saw more chaos in USDJPY as Kuroda spoke then The BoJ reportedly clarified his comments... but it seems FX traders weren't buying the denial... Of course asymmetrically echoed the sudden spike in USDJPY (ignoring its demise)...
A weak dollar helped send all major commodities higher on the week...
Gold continues to lead The Dow since The Fed hiked rates in December...
Another not-very-pretty week for cryptos amid South Korean crackdowns and Japanese exchange hacks...Ethereum managed to hold on to a 1% gain while the rest fell led by a 21% plunge in Ripple...
Bitcoin stabilized around $11,000...
Finally, we leave you with this... for no good reason...


Marine One wheels up from #Davos. View from the helo trailing Marine One.
Bonus Chart: From Tom McClellan - Bitcoin as a leading indicator for The Dow...?

This Is What Market Madness Looks Like

2018 has seen something unusual happen...
As stocks have soared, so the implied volatility of the S&P 500 has also  - very unusually - risen...
In fact VIX and the S&P are up for 3 straight weeks - the longest streak since Feb 2013.
Typically this is interpreted negatively as it would seem people are paying up for downside protection as stocks go ever higher and ever more parabolic.
But 2018 has been anything but typical: It appears that everyone's buying calls into the rally, accelerating it in the process!
Thus the rise in VIX (which measures the 'around the money' implied vol of the S&P) is being driven higher by exceptional demand for calls -  upside levered bets that this crazy melt-up continues - as demand for downside protection slides lower the higher the market goes!
And finally this is what real market madness looks like.
The normally extremely high correlation between upside implied volatility and downside implied volatility has totally and utterly collapsed, confirming that as the market soars the only "protection" being bought is... upside.
So to summarize - investors are now so convinced - by years of volatility suppression by the market's central bank sponsors - that nothing can go wrong, that they are paying up dramatically to own leveraged positions in equity markets like never before... and dismissing any need for downside protection like never before.
Of course, who needs downside protection when there's levered equity risk to buy with both hands and feet.

venerdì 26 gennaio 2018

Sounds The Alarm: "Biggest Sell Signal In 5 Years Was Just Triggered"


One week ago, Bank of America's Michael Hartnett showed  that as a result of the ongoing stock market euphoria, the 4-week inflow into stocks had hit the highest ever, although he suggested that we were "not quite there" yet when it comes to euphoria becoming a "selling" trigger.


So fast forward one week, when according to BofA's latest weekly flow show, we finally made one-week history as investors poured the most money on record into equity funds, and warning that with the Bull & Bear indicator surging to 7.9 "the highest since last sell signal >8 triggered Mar'13", a tactical pullback in sky-high markets in February and March is now "very likely".
Overall, as part of what Hartnett calls a "non-stop euphoria cabaret" markets saw a record $33.2bn inflow to equity funds this week, record $12.2bn inflow to active funds, $1.5bn into gold (50-week high), as well as record inflows to tech & TIPS.
And while we all know how overbought the market is, here are two stunning statistics:
  • 98% of global equity markets trading above 50 & 200 day moving averages
  • AUM of SPY ETF now = GDP of Denmark.

Some further details on the historic inflows by region and product:
  • broken by region, it was more of the same as U.S. equities saw $7bn of inflows, Europe $4.6bn, Japan $3.4bn; while EM funds had the 2nd best week of inflows on record at $8.1bn.
  • On the credit IG bond funds gain $2b in 57th straight week of inflows, HY bond funds see outflows of $2.5b, EM debt inflows $1.6b
And while the rotation from debt to equity has not yet happened, a subset of debt - junk bonds - is clearly throwing in the towel, as shown in the chart below, which shows that equity flows relative to credit flows at all-time high (Chart 1 – HY redemptions 11/13 past weeks & slowing IG inflows); here Hartnett reminds us that "credit leads equities (except in bubbles)."
Looking at FX flows, BofA writes that as a result of the "tainted dollar", EM debt & equity inflows close to May'13 peak, which helps explain recent surge in EM currencies:
d
A little more euphoria and it will be time to sell emerging markets: "EM Equity Flow Trading Rule…$5bn into EM equities next week triggers 1st sell signal since Aug'14"
So going back to the BofA "sell signal" that was just triggered, Hartnett explains that the BofAML Bull & Bear indicator just surged to 7.9, highest since last sell signal >8 triggered Mar'13.
From here, inflows into HY/EM debt/equity funds would flip "soft sell" for risk assets to "hard sell".
Euphoria charted: BofAML GWIM private client equity exposure rising at fastest pace in 10 years...
... and cash allocation at record low (10%).
Should one trust the BofA Bull and Bear indicator? Well, yes: "BofAML Bull & Bear indicator has given 11 sell signals since 2002; hit ratio = 11/11; "
What happens next? Well, once hit, the average equity peak-to-trough drop following 3 months = 12% (backtested, Table 1); note the last Bull & Bear indicator flashed was a buy signal of 0 on Feb 11th 2016.
Putting it all together, BofA warns that a "tactical S&P500 pullback to 2686 in Feb/Mar now very likely."
And here is what can spark it:
"The Art of Falling Apart: US dollar key catalyst; note US-Europe FX spat sparked '87 crash; higher US$ "pain trade" = risk-off coming weeks; we reiterate 2018 calls: Big Long = Vol, Big Short = Credit, Big Risk = Equity Bubble (driven by $10.3tn of negatively yielding debt), Big Rotation from Davos Man to Joe-Six Pack portfolio"
Will this time finally be the charm for BofA's recurring warnings of an imminent market plunge? The next 2 months will reveal if - this time - it was finally right...

$11,589.01?... Ask The Swiss!

$11,589.01.


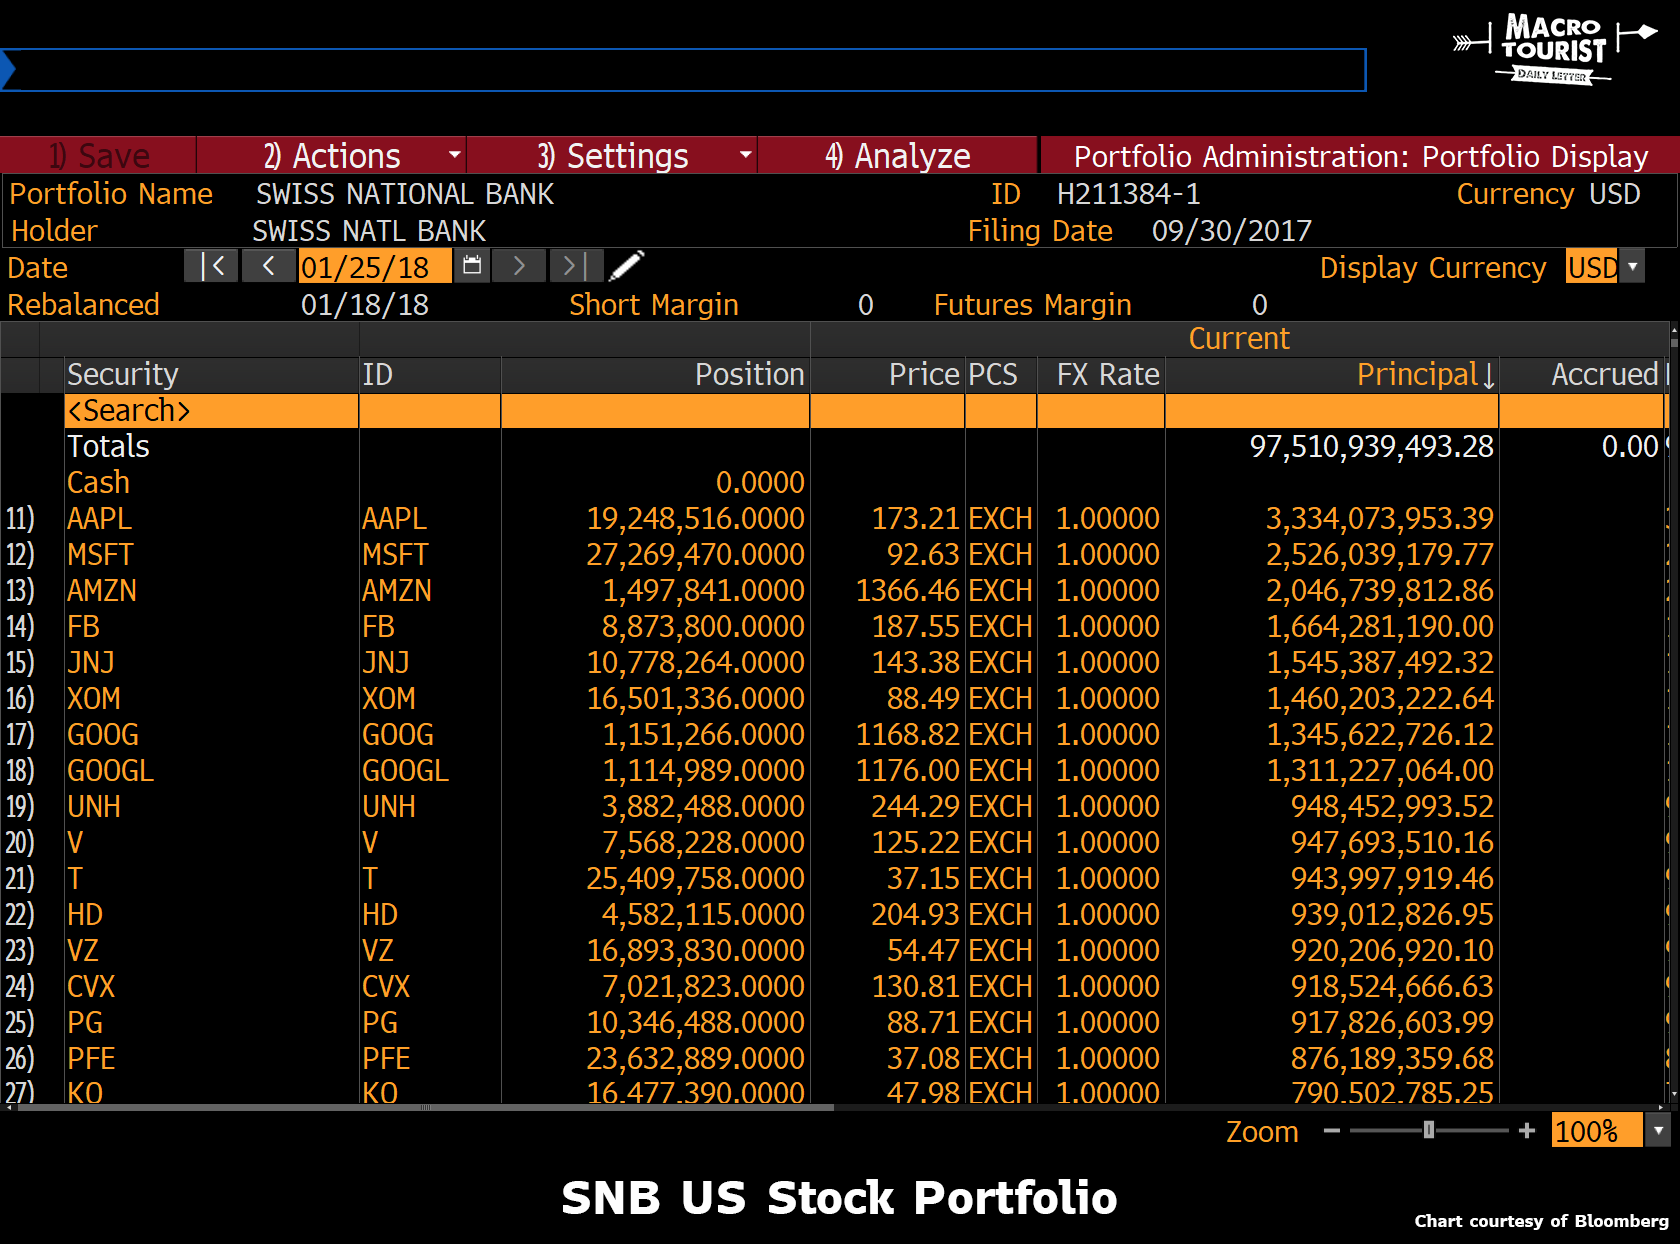
That's the US dollar amount of American stocks the Swiss National Bank owns on behalf of every man, woman and child in Switzerland.Let that sink in.
A Central Bank has taken on itself to expand its balance sheet and invest in the proceeds, not in gold, nor sovereign debt - heck not even in corporate bonds. Nope, the SNB has taken it upon itself to "invest" that money in another country's most risky part of the capital structure - equity.
And don't think it's a small number. It's almost $100 billion US dollars.
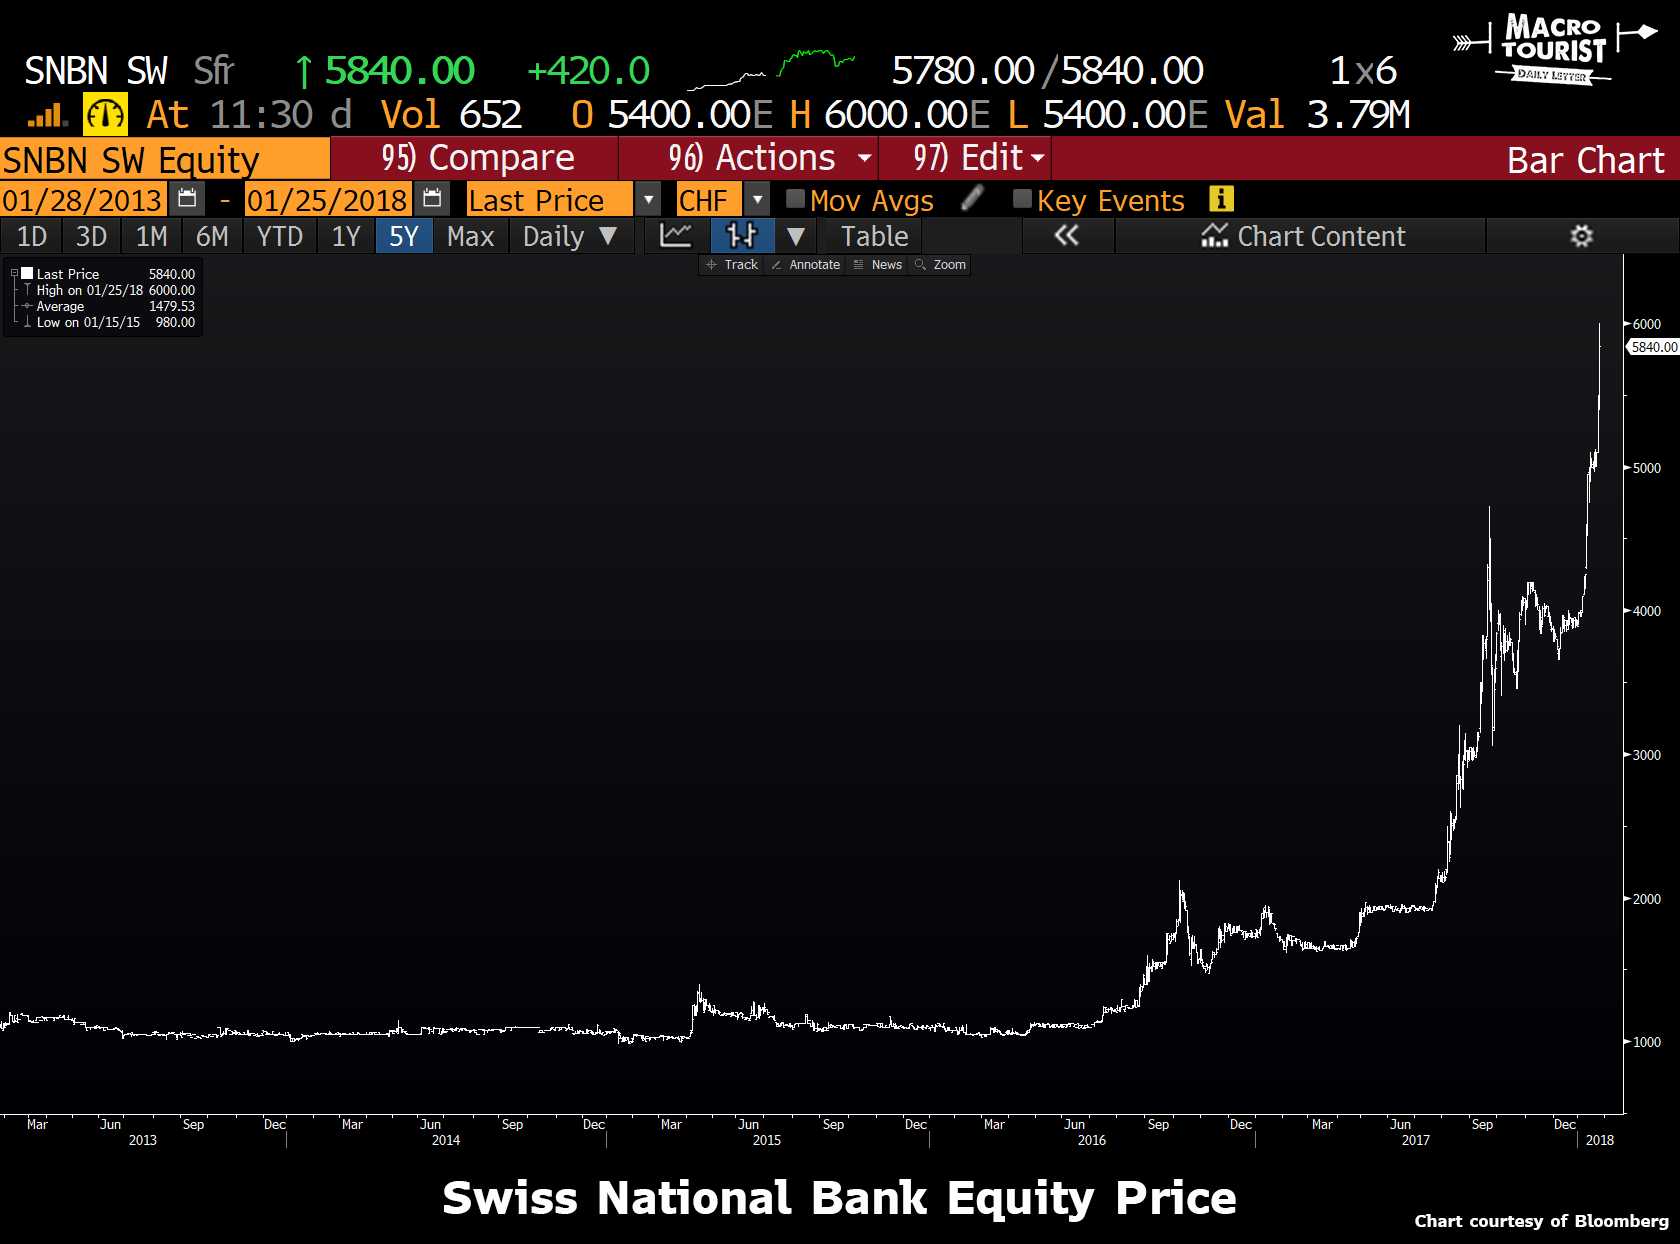
In a strange twist of fate, the Swiss National Bank is not only Switzerland's Central Bank, but also a publicly traded security. I know, it makes little sense, but in this day and age, what does? Anyways, the financial community is all abuzz with SNB's rocket ship chart formation.
The SNB's equity price market capitalization is only 584 million CHF, so when you consider that the S&P 500 is up almost 6% since the start of the year, and that the SNB owns $100 billion of stocks which are up $6 billion USD during the last two months, maybe it makes sense to take a punt of buying some SNB equity. Now, who really knows how to value this security? Those gains should accrue to Swiss citizens as opposed to SNB equity holders, but it's easy to understand the excitement.

The real problem

It's all fun and good to speculate on the SNB equity price, but I am more interested in what the SNB's behaviour means for the global markets going forward.
The real problem is that a Central Bank just monetized their balance sheet against another country's equity market, and instead of getting punished for this reckless behaviour, the markets are celebrating the Swiss good fortune. And I ask you - have you ever seen Central Bankers not behave like a bunch of antelopes on the Serengeti? It is an amazingly disturbing precedent.
The Swiss National Bank has gone down a rabbit hole from which it will be extremely difficult to surface. Not only does every Swiss citizen own indirectly through the Central Bank more than $10k of US stocks, but their total assets per capita is over $94,000 each!
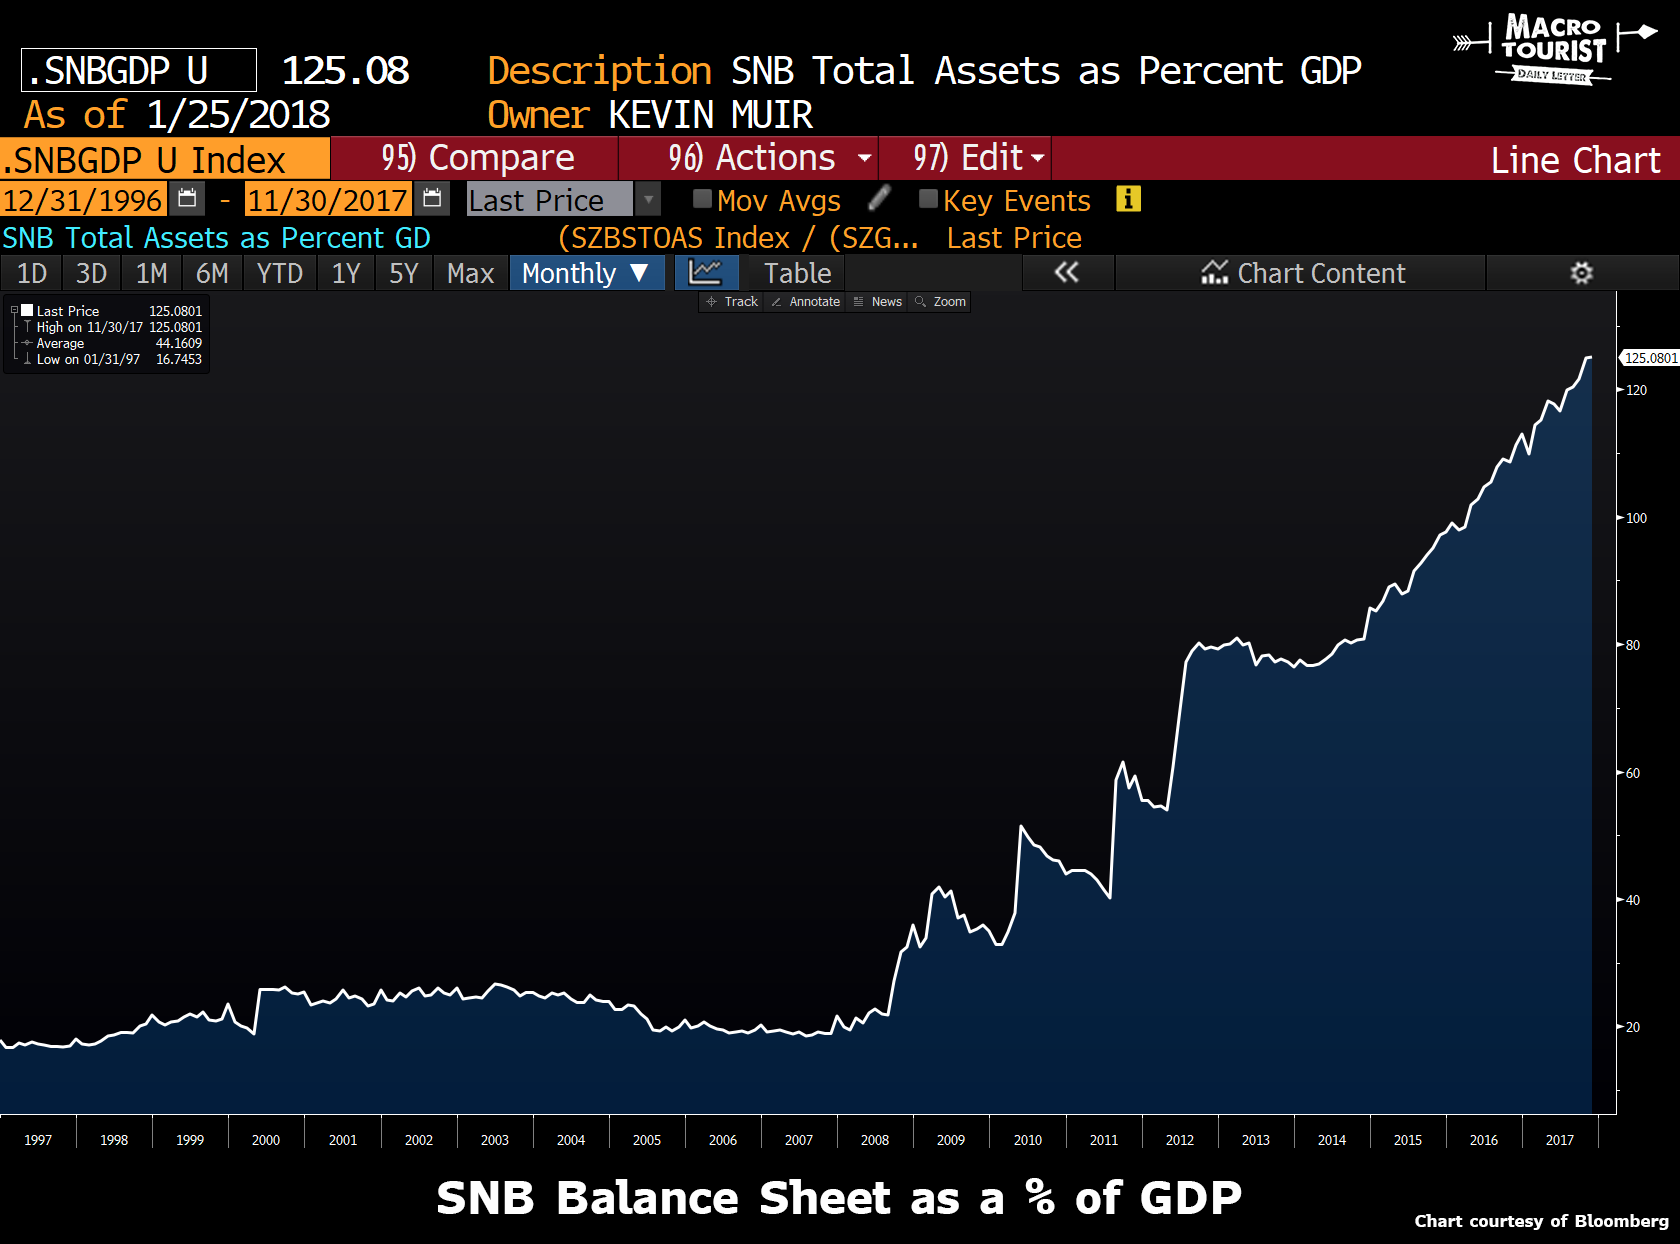
Since the 2007 Great Financial Crisis, the SNB has taken the size of their balance sheet from 20% of GDP all the way to 125%!
And look at the period from 2014 to today. From 80% to 125%. And that was during a period of relative calm in both the markets and the economy.
What's going to happen when the global economy rolls over?
This sort of balance sheet expansion, and especially with the corresponding move out the risk curve, is complete madness.
I know many market strategists are issuing warnings about markets due to forecasted global Central Bank asset tapering. I sure hope they are correct that this insanity ends soon. But I worry that we are being naive.
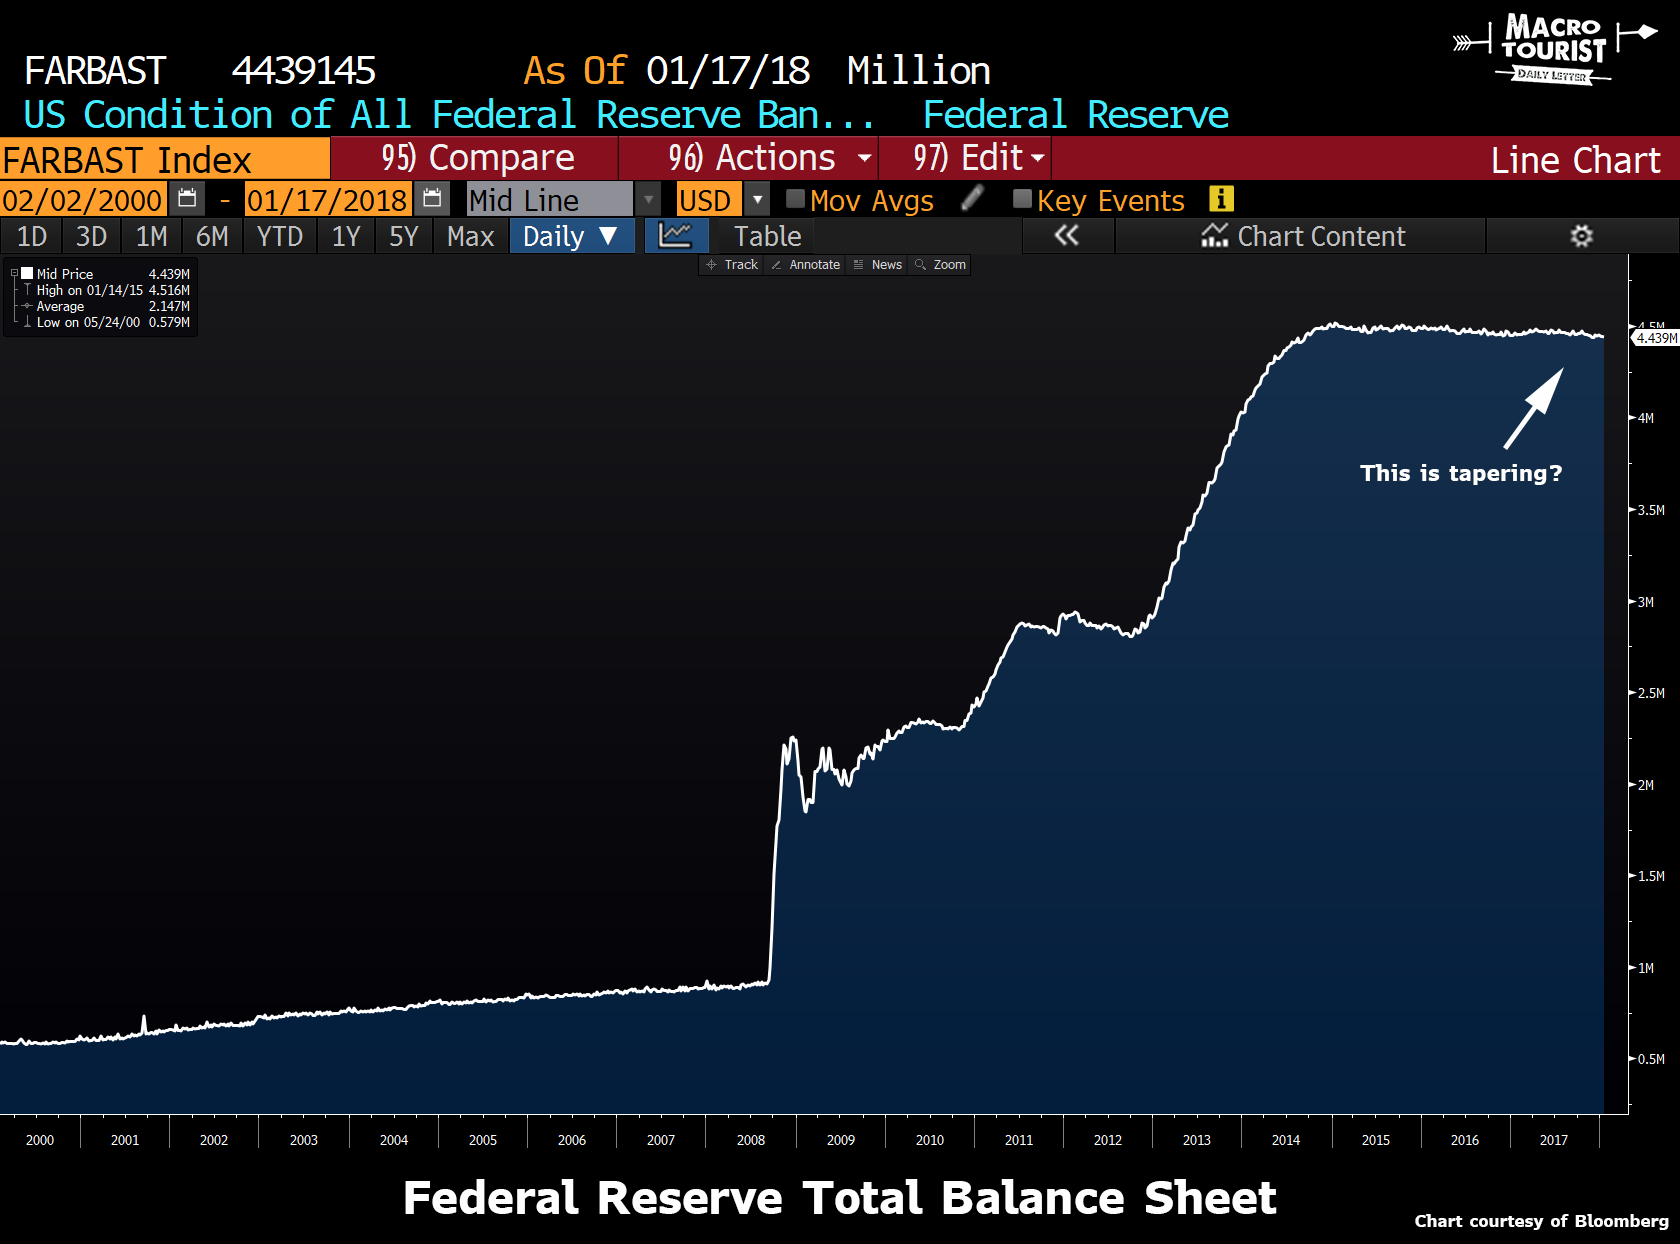
Have you looked at the Federal Reserve's balance sheet lately? I know they are on a schedule to taper, but it's at a glacial pace.
I worry that right now, Central Banks are being rewarded for keeping their balance sheets as big and risky as they can stomach. It appears to be a trade with no cost, and in fact, helps out by both keeping their currency weak, and in the meantime, making some money. It encourages them to be extremely slow easing off the accelerator.
The idiocy of Central Banks taking this sort of risk is beyond description, but no sense arguing about it - it is what it is. But make no mistake, it's like wearing jeans, a denim shirt, and a jean jacket at the same time (the Canadian tuxedo), it just shouldn't be done (unless you are Ryan Gosling and then somehow the ladies seem to like it - go figure…)
I don't have any conclusions to draw from this diatribe. I don't think you should take this as some sort of apocalyptic warning about a coming crash. In fact, it's probably just the opposite. If this sort of Central Bank insanity continues at this pace even though the global economy is firmly in the green, then it only affirms my belief that Bill Fleckenstein was correct when he said, "the bubbles will continue until the bond market takes away the keys."
PS: If the Federal Reserve decided to invest $11,589 in the US stock market per American citizen, they would need to buy $3.75 trillion of stocks… That would mean they would have to almost double the already inflated balance sheet. That's the level of absurdity from the Swiss National Bank.