MARKET FLASH:

"It seems the donkey is laughing, but he instead is braying (l'asino sembra ridere ma in realtà raglia)": si veda sotto "1927-1933: Pompous Prognosticators" per avere la conferma che la storia non si ripete ma fà la rima.


venerdì 8 dicembre 2017

IMF Stress Tests Find $280 Billion Black Hole In Chinese Bank' Capital


The IMF released a new analysis on the instability stability of the Chinese financial system. Speaking to the media in an online briefing, some of the insights from Ratna Sahay, deputy director of the IMF's Monetary and Capital Markets Department, hardly advanced our knowledge much.

Sahay noted that "Risks are large. Having said that, the authorities are really aware of risks and they are working proactively to contain these risks." 

That's why the authorities are finally racing to contain the worst excesses of China's insane credit boom following October's Party Congress, for example overhauling the $15 trillion shadow banking and asset management sector. As we noted on the latter, the new measures don't take effect until the end of June 2019, no doubt reflecting the enormity of the problems uncovered by Chinese regulators.

Sahay pointed to three main risks: credit growth, the complex and opaque financial system and implicit guarantees which "encourage excessive risk-taking" (think WMPs). 

However, the IMF does a better job in explaining why a massive financial crisis in China is all but inevitable – the conflicting needs of social stability versus financial stability. According to Reuters.

But the near-term prioritisation of social stability seems to depend on credit growth to sustain financing to firms even when they are non-viable, it said. "The apparent primary goals of preventing large falls in local jobs and reaching regional growth targets have conflicted with other policy objectives such as financial stability," the report said. "Regulators should reinforce the primacy of financial stability over development objectives," the fund said.

Too late.

Xi Jinping and his predecessors allowed the excesses to go too far before Xi had solidified his grip on power sufficiently to intervene. The IMF itself has been missing in action when it comes to assessing China's financial stability, as the latest report was the first of its kind since 2011. In terms of a financial system which has been out-of-control, we can use growth in the wealth management products (WMPs) as a proxy.

The IMF conducted stress-tests on 33 Chinese banks in a so-called "severely adverse scenario" and the majority failed. The capital shortfall even under this scenario was a staggering $280 billion dollars, about 2.5% of GDP. We should highlight – and we suspect it's significance won't be lost on readers – that the IMF stated in a footnote that the PBoC did not provide access to all of the "supervision data" it needed to properly conduct the stress tests. Bloomberg discusses the results.

China's banks should increase their capital buffers to protect against any sudden economic downturn following a credit boom, the International Monetary Fund said. In its first comprehensive assessment of China's financial system since 2011, the IMF recommended "a gradual and targeted increase in bank capital." In a worst-case scenario, IMF stress tests suggested the country's lenders would face a capital shortfall equivalent to 2.5 percent of China's gross domestic product -- about $280 billion in 2016 -- together with ballooning soured loans.

Overall, 27 of 33 banks stress-tested by the fund, covering about three quarters of China's banking-system assets, were under-capitalized by at least one measure. A larger financial cushion would better reflect potentially underestimated risks stemming from the banks' exposure to opaque investments, and absorb losses as implicit government guarantees are removed, the fund said.

We are struggling to believe the IMF's finding that the "Big Four" state-owned banks have sufficient capital. As explained in the past there is an epidemic of fraudulent loans in China, with all parties, including the legal profession and the courts, complicit. At the same time, Xi is cracking down on the systemic corruption within government, so it doesn't take much to link the two in the case of the Big Four. Nevertheless, Bloomberg notes the IMF's assertions.

China's top four banks, led by the world's largest lender by assets Industrial & Commercial Bank of China Ltd., have enough capital, the fund said. But it said the nation's smaller lenders, including those focused on individual cities "appear vulnerable."

"Stress test results reveal widespread under-capitalization of banks other than the Big Four banks under a severely adverse scenario," the fund said in its report. "Increasing capital would enhance the resilience and credibility of the financial system, as well as reassure markets." The fund didn't name the specific banks that need more capital.

There are some moments of mild tragi-comedy in the IMF's report, for example, when it notes that the official proportion of non-performing loans in the Chinese banking system – 1.5% at the end of June 2017 – may understate the reality. Even using the official figures, China's "debt at risk" exceeds most other major EM economies.

Stress-testing the 22 Chinese banks under the "severely adverse" scenario, the IMF calculate that the non-performing loan ration would rise from 1.5% to 9.1%, cutting tier 1 capital ratios by 4.2%. Under these circumstances, bank would have to slow the pace of lending to the Chinese economy and the fiscal impact could exceed the direct recapitalization needs of the banking system "by a wide margin", a.k.a a major crisis.

The PBoC responded surprisingly quickly to the IMF report. Regarding the very low official figure for bad debts, it noted that it resulted from banks having written off the bad ones, although obviously doesn't square with the incredibly low number of defaults which continues to be a feature in the banking system. Bloomberg reports the response to the stress tests as follows.

Responding to the report, the People's Bank of China said the assessment was generally fair but disputed the IMF's interpretation of the stress test results. "Comments about the stress test in the report do not fully reflect the results of the tests," the central bank said in a statement on its website Thursday. "China's financial system has shown relatively strong capability to cope with risks."

As we've found to our own cost on many occasions, hubris is not a good think when it comes to financial markets.

To its credit, the IMF's staffers did place a lot of focus on the risk from guaranteed returns and off-balance sheet exposure in China's $4 trillion WMP sector. Without calling it a Ponzi scheme, they identify the possibility of a bank-run.

"Off-balance sheet WMPs also represent a significant risk to capital," the report said. "They are not guaranteed, but banks almost always compensate retail investors for principal losses. In a stress scenario, the costs to the banks of supporting WMPs could be substantial and could, in case of a run, place the liquidity position of some banks under strain."

As part of the stress-tests, the IMF discovered four banks that could suffer liquidity shortfalls within 30 days, while confirming that the liquidity position of the Big Four was "strong" (hmmm). Besides increasing bank capital, holding more liquid assets and reforming WMPs, we were intrigued by another of the IMF's recommendations. The IMF stated that the PBoC and other regulators needed a substantial increase in staffing. We find this hard to believe…and very worrying…but the IMF found.

…the staff count at the "PBoC and the regulatory agencies has not risen in 10 years, while the financial sector has doubled in size.

It's even less surprising how fraudulent lending grew into an epidemic in the Chinese financial system. What the IMF report doesn't say is that it's gone way too far to ever be reined back in orderly fashion. We are reminded of some Bank for International Settlements (BIS) analysis discussed by Bloomberg a year ago. The BIS found that the single most reliable indicator of looming banking crises is when the aggregate of credit to households and businesses exceeds GDP by more than 10% (as it did prior to the US subprime crisis). Needless to say, China was well past the point of no return.

giovedì 7 dicembre 2017

Five Charts That Show We Are on the Brink of an Unthinkable Financial Crisis

Bonfires are fun to watch, but they eventually burn out.

Human folly apparently doesn't, so we just keep adding to the absurdities. The volume of daily economic lunacy that lights up my various devices is truly stunning, and it seems to be increasing. Let's take a look at a series of charts I received from my "kitchen cabinet" of friends.

The Economy Is More Deleveraged Than Ever

First up is Grant Williams who sent me a monumental slide deck. Here is just one example of craziness.

Source: Grant Williams

This chart is straightforward: It's outstanding credit as a percentage of GDP. Broadly speaking, this is a measure of how leveraged the US economy is.

It was in a sedate 130%–170% range as the economy industrialized in the late 19th and early 20th centuries. It popped higher in the 1920s and 1930s before settling down again. Then came the 1980s. Credit jumped above 200% of GDP and has never looked back.

It climbed steadily until 2009 and now hovers over 350%.

Absurd doesn't do this situation justice. We are mind-bogglingly leveraged. And consider what the chart doesn't show. Many individuals and businesses carry no debt at all, or certainly less than 350% leverage. That means many others must be leveraged far higher.

While lending has been a very lucrative business in recent decades, it's hard to believe it can last. At some point we must experience a great deleveraging. When that happens, it won't be fun.
Cash Allocation Is Lowest Since 2007

"Contrarian" investors believe success lies in going against the crowd, because the crowd is usually wrong. My own experience suggests one small adjustment: Pay attention not to what the crowd says but to what it does. Words are cheap.

This next chart is a prime example.

We see here the amount of cash held by Merrill Lynch clients from 2005 to the present, as a percentage of their assets. The average is about 13%.

Source: Fasanara Capital

The pattern is uncanny. In 2007, as stock indexes reached their peak, cash holdings were well below average. They rose quickly as the crisis unfolded, peaking almost exactly with the market low in early 2009.

In other words, at the very time when it would have been best to reduce cash and buy equities, Merrill Lynch clients did the opposite. And when they should have been raising cash, they kept their holdings low. I don't think this pattern is unique to Merrill Lynch's clients; Market timing is hard for everyone.

The disturbing part is where the chart ends. Merrill Lynch client cash allocations are now even lower than they were at that 2007 trough. Interest rates are much lower, too, so maybe that's not surprising.

Central banks spent the last decade all but forcing investors to buy risk assets and shun cash. This data suggests it worked. But whatever the reason, investor cash levels suggest that caution is quite unpopular right now.

So if you consider yourself a contrarian, maybe it's time to raise some cash.
Michael Lewitt's Reality Check

Michael Lewitt's latest letter came in this morning. He began with the marvelous Ralph Waldo Emerson quote that I used at the beginning of this letter, and then he helpfully contributed this list of absurdities:

Anyone questioning whether financial markets are in a bubble should consider what we witnessed in 2017:

• A painting (which may be fake) sold for $450 million.
• Bitcoin (which may be worthless) soared nearly 700% from $952 to ~$8000.
• The Bank of Japan and the European Central Bank bought $2 trillion of assets.
• Global debt rose above $225 trillion to more than 324% of global GDP.
• US corporations sold a record $1.75 trillion in bonds.
• European high-yield bonds traded at a yield under 2%.
• Argentina, a serial defaulter, sold 100-year bonds in an oversubscribed offer.
• Illinois, hopelessly insolvent, sold 3.75% bonds to bondholders fighting for allocations.
• Global stock market capitalization skyrocketed by $15 trillion to over $85 trillion and a record 113% of global GDP.
• The market cap of the FANGs increased by more than $1 trillion.
• S&P 500 volatility dropped to 50-year lows and Treasury volatility to 30-year lows.
• Money-losing Tesla Inc. sold 5% bonds with no covenants as it burned $4+ billion in cash and produced very few cars.

This is a joyless bubble, however. It is accompanied by political divisiveness and social turmoil as the mainstream media hectors the populace with fake news. Immoral behavior that was tolerated for years is finally called to account while a few brave journalists fight against establishment forces to reveal deep corruption at the core of our government (yes, I am speaking of Uranium One and the Obama Justice Department). In 2018, a lot of chickens are going to come home to roost in Washington, D.C., on Wall Street, and in the media centers of New York City and Los Angeles. Icons will be blasted into dust as the tides of cheap money, cronyism, complicity, and stupidity recede. Beware entities with too much debt, too much secrecy, too much hype. Beware false idols. Every bubble destroys its idols, and so shall this one.
The Fed's Balance-Sheet Unwind Spells Trouble

The next absurdity is absurd because it is so obvious, yet many don't want to see it. Too bad, because I'm going to make you look.

This comes from Michael Lebowitz of 720 Global. It's the S&P 500 Index overlaid with the Federal Reserve's balance sheet and the forecast of where the Federal Reserve intends to take its balance sheet.

Source: 720 Global

The Fed and other central banks have practically forced investors into risk assets since 2008. You can see the relationship very clearly in this chart. The green segments of the S&P 500's rise occurred during quantitative easing programs.

Correlation isn't causation, but I think we can safely draw some connections here.

Ample low-cost liquidity drives asset prices higher. That's not controversial. It makes perfect sense that the withdrawal of ample low-cost liquidity would also impact asset prices in the opposite direction.

The Fed has even given us a schedule by which it will unwind its balance sheet. Michael's chart gives us a sense of how far the S&P 500 could drop if the Fed unwinds as planned and if the relationship between liquidity and stock prices persists. Either or both of those could change; but if they don't, the S&P 500 could fall 50% in the next few years.
Volatility-Linked Hedges Won't Deliver in a Flash Crash

Many investors see all these warning signs but think they can keep riding the market higher and hedge against losses at the same time. It doesn't really work that way.

Wall Street firms have rolled out all kinds of volatility-linked products that purport to protect you from sudden downside events. Most of these products are linked to the Volatility Index, or VIX.

Volatility has been persistently low as the market has risen in recent years. That has made it cheap to buy protection against a volatility spike. However, it's not clear if the sellers of this protection will be able to deliver as promised.

My friend Doug Kass has been concerned about this for some time. He believes the risks of a "flash crash" are rising, and those who think they are hedged may learn that they are not.

He shared this Morgan Stanley graphic of how many VIX futures contracts would have to be bought to cover a one-day market drop.


Between hedgers, dealers, and ETP sponsors, a one-day 5% downward spike in the S&P 500 would force the purchase of over 400,000 VIX futures contracts. This was in October, and the figure has probably risen more since then. Doug isn't sure a market under that kind of stress can deliver that much liquidity.

I suspect the various VIX-linked products will disappoint buyers when the unwind occurs.
High-Yield Debt Might Be a Trigger for the Next Crisis

Doug also shared what will be the final graph for this week and observed, "This is the dreaded alligator formation, and the jaws always close."

It's just a matter of time. It could take another year and get even sillier, but when that gator snaps its jaws shut, a lot of people will get bitten.

I personally think the bubble in high-yield debt, accompanied by so much convenant-lite offerings, will be the source of the next true liquidity crisis.

Source: ZeroHedge

The amount of money available to market makers to use to maintain some type of order in a falling high-yield market is absurdly low. Investors in high-yield mutual funds and ETFs think they have liquidity, but the managers of those funds will be forced to sell into a market where there is no price and there are no bids.

Oh, the bids will show up at 50% discounts. Distressed-debt funds and vulture capital will see opportunities, and they will be there. Talk about blood in the streets

The Moment The Market Broke: "The Behavior Of Volatility Changed Entirely In 2014"

Earlier today we showed a remarkable chart - and assertion - from Bank of America: "In every major market shock since the 2013 Taper Tantrum, central banks have stepped in (even if verbally) to protect markets. Following the Brexit vote, markets no longer needed to hear from CBs as they rebounded so quickly that CBs didn't need to respond." As a result, buy-the-dip has a become a self-fulfilling put.

The immediate result of this dynamic has been two-fold: i) investors now buy every dip, or as Bank of America notes, "Investors no longer fear shocks, but love them, as it is an opportunity to predictably generate alpha.", and ii) selling of vol has become a self-reinforcing dynamic, in which lower VIX begets more vol-selling by "yield-starved investors", leading to even lower VIX as the shock that can reset the feedback loop is no longer possible, and thus the strike price on the Fed's put can not be put to a market test.

These observations prompt BofA's derivatives expert Benjamin Bowler to ask the rhetorical question: "volatility: new normal or bubble?" and answer: "It's a bubble." Indeed it is, but absent the abovementioned market-clearing shock, it is difficult, if not impossible to anticipate what can burst this bubble.

In the meantime, the market has spawned some spectacular distortions, including the following observation: "As one measure of volatility, the Dow Jones Industrial Average traded in its tightest trading range since 1900 this year." Here is Bowler:

While asset valuations are not at life-extremes, volatility is. In 2017 the Dow traded in a 110yr record tight trading range, the VIX hit all-time lows, and US equities reversed from sell-offs at near their fastest pace in 90 yrs. Investors no longer fear risk but love it, as it's another opportunity to harvest "dip-alpha". Volatility across asset classes has decoupled from uncertainty. Even if seemingly irrational, apathy to all risk has been the right trade and an impossible trend for most to fight – the definition of a bubble.

A bubble, he adds, "induced by years of heavy handed central bank influence, where investors have learned that it has not paid to panic." Bowler asks readers to consider the following:

As one measure of volatility, the Dow Jones Industrial Average traded in its tightest trading range since 1900 this year


Near 90yr records are occurring in the speed that US equities are recovering from dips


The VIX is near 26yr lows despite political & policy uncertainty recently near 26yr highs


Gold call options price less than 1 in 100 chance of rising North Korean tensions in the face of rising North Korean tensions


The above leads Bowler to concludes that "while there is active debate about whether risk-assets like equities and credit are overvalued, it is much harder to argue that currently depressed volatility levels are unsustainable when near 100yr records in terms of low vol and the lack of persistence of any shock are being recorded."

So when did the market "break", and when did the behavior of volatility change so dramatically?

This overarching question has been plaguing Wall Street strategists for much of 2017. In July, we presented one answer from Deutsche Bank's Aleksandar Kocic who pointed out the divergence between the economic policy uncertainty index and the VIX, which took place roughly in 2012, prompting the derivatives expert to conclude that something "snapped" roughly around that time, or as Kocic said, sometime in 2012 it was as if the markets "lost their capacity to deal with uncertainty."


Bank of America takes a somewhat different approach, and instead of looking at the divergence between volatility and news - or shock - flow, highlights the moment BTFD became religion.

According to Bowler, "the nature of volatility since 2014 has entirely changed, with volatility shocks retracing at record speed. Investors no longer fear shocks, but love them, as it is an opportunity to predictably generate alpha." This is demonstrated in the following stunning chart which not only shows that every VIX dip is now just an opportunity to buy it, but that the market's "fragility" is at an all time high based on the surging frequency of vol spike events, which in turn, and paradoxically, reassure investors that a central bank backstop can not be too far away.


BofA is hardly the first to point out this phenomenon: almost exactly one year ago, it was JPM's "quant wizard" who highlighted precisely the same, if not through the perspective of VIX but the overall market response to recover from "shock" events:

It appears that the time horizon of macro traders has shortened, likely as a result of increased participation of machines and algorithms that are quicker to adjust to significant events and can eliminate trading activity of slower investors. Consider for example the US elections - traders in Japan registered a 5.4% Nikkei drop on the 9th, followed by a 6.7% rally on the 10th, while S&P 500 investors did not register a significant close-to-close move over the election (due to market hours difference). These two days were enough to shift the volatility regime (usually calculated from closing returns) for the whole of 2016 for the Japanese equity market, and leave it unchanged for S&P 500 (e.g. think of rebalancing needs of a hypothetical risk parity fund, or a short volatility strategy based on Nikkei vs. one based on S&P 500). We also noticed that for a number of significant catalysts this year (Brexit, US Election, Italy Referendum) broad expectations were wrong both on the outcome and the directionally forecasted impact. It is possible that the lack of market reaction (or a reaction that went against the accepted narrative) was in part driven by investors' reluctance to transact ("two negatives equal a positive").


Ah yes, the infamous "investor reluctance to transact", which has only gotten worse as we hinted in our "trader paralysis" post, and which Goldman demonstrated vividly just last month when the bank showed that hedge fund turnover has now dropped to an all time low as virtually nobody trades anymore.


Whatever the reason behind the broken market, however, whether it is central banks, machines, algos, risk parity funds, vol-targeting strategies,  self-reinforcing "Pavlovian" dynamics, or simply traders no longer trading, the question is what comes next? While we will have a more detailed breakdown in a subsequent post, here are Bowler's three questions, and several answers of what to expect in 2018:

As we enter 2018, three questions are top of mind when it comes to volatility:

Is 2018 the year when vol begins to normalize, or is this the "new normal"?

As low vol threatens to sow the seeds of the next crisis, how will this end?

Where does vol go in the longer-run; can we ever see the old-normal return?

Vol likely to rise off extreme lows; '87 crash unlikely, but so is VIX averaging 20 While we will look at each question in more detail in turn, the short answers are:

Higher not lower vol: We think 2018 is most likely to see higher (not lower vol) as the Fed builds more "ammunition" in terms of rate-hikes leaving them less sensitive to financial market conditions (i.e. pushing the Fed put strike lower), and as CB balance sheets peak in 2018.

Vol bubble more likely to deflate than explode: While the risk of "fragility" shocks due to positioning and feeble liquidity is high, we think the level of leverage today, which is lower compared to the last time vol was this depressed (2007), does not present the same risks as then.

Vol to remain low vs. long-run average: However, to the extent we remain in a low inflation/low rates environment, we may also remain in a lower than normal vol environment. So while VIX near 9 is an unsustainable bubble, VIX at 20 (the long-run average) may also be unsustainable in a slower growth world.

And BofA's conclusion:

What to watch for? In a world slaved to rates, inflation remains key

From a macro perspective, we continue to believe unexpected inflation is the kryptonite for volatility. Inflation presents a "triple whammy", first driving economic vol higher, destabilizing bond markets (and putting bond/equity correlation at risk), but importantly handcuffing central banks from being as sensitive to financial markets. In other words it both drives fundamental risk higher and significantly impairs the protection markets have become dependent on. Rising rates vol is key to watch.

How bad can it get? From here Aug-15 shock likely but '87 crash is improbable

Interestingly, while the world is hyper-focused on how big the "short-vol" trade is, history shows that any liquidity shock large enough to create an equity bear market (20% fall in equities, similar to 1987 or LTCM crisis) provides a forewarning in terms of rising volatility first (look for S&P vol to double from 10 to 20). Fragility shocks (similar to Aug-15) that happen without warning remain the bigger risk today in our view.

So, how do you trade this? Long "vol beta", cheap options for direction

The most important question is, how do you trade this environment where investors have given up on risk (or have learned to love it as buying dips has been "free money"). Evidence of a "bubble in apathy" is strong, and we believe it is unsustainable. However, the problem with any bubble is not recognizing you are in it but rather timing its end. Hence the key is finding trades that will profit from a change in environment but carry well and hence don't require perfect timing. The beauty of today's low vol is that it can be cheap to own optionality (for example for upside stock replacement) which affords the benefit of not having to time when markets may peak.

Does this mean short vol is a bad idea? No, but it needs to be smartly managed

Importantly, believing that today's low vol is unsustainable does not mean all short vol positions are bad. Don't forget, owning any risk asset (equity, credit etc.) is a short-vol trade. The key is finding the best short vol opportunity (highest risk-adjusted returns), while managing downside risks appropriately. Harvesting rich vol risk-premia is key to funding cheaper long vol positions elsewhere.

mercoledì 6 dicembre 2017

BofA: "In Every Market Shock Since 2013 Central Banks Have Stepped In To Protect Markets"

There is a reason why those calling for a crash, or even a market correction in the past decade, have been carted out feet first: central banks, and noweher was this more obvious than the shocking aftermath of Brexit. The UK's Brexit vote (Jun-16) marked the point when the buy-the-dip trade became a self-fulfilling put, according to a new analysis by Bank of America.
However the buying did not develop on its own: "From the taper tantrum in 2013 through the Aug-15 China devaluation shock when Yellen decided not to raise rates due to "weak equities" (which were only down just over 10% from life-highs) the Fed consistently (even if only verbally) supported markets during stress."
At that point the "buy the dip" Pavolovian reflex was so strong, central banks could dit back and watch: sure enough, when in early 2016 Yellen suggested the Fed may need to move more "cautiously" because of the risk of Brexit, once Brexit happened, the market rebounded so quickly (3 days) it did not need to step in. From that point forward, dips have only become shallower as investors compete for "dip alpha".


Or as BofA summarizes, "In every major market shock since the 2013 Taper Tantrum, central banks have stepped in (even if verbally) to protect markets. Following the Brexit vote, markets no longer needed to hear from CBs as they rebounded so quickly that CBs didn't need to respond. Buy-the-dip has a become a self-fulfilling put"
This brings up two interesting observations: i) the Fed put is falling with rising rates, and ii) paradoxically the market needs a shock to discover what the new "strike price" is, yet this is impossible due to BTDers stepping in assuming the Fed backstop. BofA explains:
The Fed put strike is falling with rising rates even if markets don't realize it. As our Head of Global Economics, Ethan Harris, has pointed out, sitting at the lower bound in rates put the Fed in risk-management mode, meaning they had to be ultrasensitive to the risk of making a policy mistake as they had no traditional ammunition to fight a potential downturn. But as the Fed gradually increases rates, and with markets seemingly unconcerned, they will inherently become less sensitive to risk. In other words, the Fed put strike is falling both because the Fed is rebuilding ammunition, and because it recognizes that markets can better stand on their own. Of course surprise inflation remains the real killer as it would effectively handcuff the Fed from providing a high strike put, and will require much higher stress before they can step in.

However, we still need to see a shock to know where the Fed put strike is. Just because the Fed put strike is falling with rising rates doesn't mean markets will recognize it until there is a shock of sufficient magnitude to test it. And while Powell is believed to have a largely similar policy stance as Yellen, until we see how he (and his new committee) react to financial stress, it's hard to know exactly where the Fed put strike sits. This fact, along with the uncertainty of when we see a sufficient shock to test the Fed, makes calling an end to this environment difficult. For example, in 2017 the strong buy-the-dip mentality, and arguably solid fundamentals, prevented the Fed from being tested.
Meanwhile, in a world without market shocks, vol continues to decline, forcing even more vol-selling in a self-reinforcing feedback loop as Citi showed yesterday.
 
 Bank of America has a slightly different representation of the various low-vol feedback loops currently active in the market:
So does this mean that the status quo continues? BofA believes the answer is yes, and "there is a clear risk that the 2017 low vol environment carries on through 2018, which is more likely if inflation were to fail to rise, prolonging the current goldilocks period. The Fed could continue to slowly plod along with hikes, and absent a sufficient exogenous shock, the market may maintain full faith that they could pause (or cut) if needed. In this case equities would again generate exceptional Sharpe ratios, beating almost any other asset, as we saw this year. As US equities recorded nearly their highest Sharpe in history this year (the Dow Jones Industrials recorded a Sharpe of 4, 99th %-ile since 1935), the chance of this repeating yet again may be lower than some expect."
Aside from inflation, however, there is one other risk to breaking the goldilocks regime: other central banks, and the extensively discussed inflection point in mid-late 2018/early 2019 when liquidity injections by all central banks fade out, and eventually become a drain of liquidity.
While the Fed is closest to normalizing policy and has been among the largest contributors to the moral hazard injected into markets, the ECB and BOJ still matter. We project G4 balance sheets will finally peak and begin to decline in Q1 '18 (Chart 8), another key inflection point in the global QE story. However, the more important question is whether QE remains effective at suppressing volatility. While it's a slow moving risk, we have noted that since 2016 more QE in Japan and Europe have not dampened vol as they had previously but in some cases (e.g. when Kuroda went to negative rates in Jan-16) actually resulted in higher volatility. This is a key reason we continue to like owning Japanese vol, as you can own QE failure risk with positive carry.


Global market cap is about to hit $100 trillion and Goldman Sachs thinks the only way is down

Global market cap is about to hit $100 trillion.

A bull run of this length — nearly nine years — was last seen before the Great Depression.
Goldman Sachs believes the "bull market in everything" is about to come to an end.
In the medium term, we face either "slow pain" or "fast pain" in the equities markets, Goldman says.

This is a chart of the value of all stocks in all companies in all countries, globally. It is, technically, the market cap of Planet Earth, and everyone who sees it does a double take. In just the last few months, total market cap has rocketed upward to nearly $100 trillion worldwide:


Business Insider / Bloomberg data

I saw the chart in a note from CLSA analyst Damian Kestel: "I almost fell off my chair when I saw this and went to check that Bloomberg hadn't reclassified some data … but no. I included this chart of total equity market cap in [a previous note to clients] in early June this year. At that point total world market cap was US$74 trillion, it's now US$93 trillion," he wrote. (The chart excludes ETFs and the like, so there is no double-counting of single stocks in different indexes.)

What is worrying about the chart is that final, fast peak in 2017. Until then, world market cap looked like any other stock index: A series of incremental gains building on each other over time, with a pronounced dip around the Great Financial Crisis in 2008, followed by a healthy recovery.

This year, the chart just looks insane.
In the medium term there will be either "slow pain" or "fast pain"

Goldman Sachs international analyst Christian Mueller-Glissmann and his colleagues think the "bull market in everything" is about to come to an end. "the average valuation percentile across equities, bonds and credit is the highest since 1900," they write, and it will produce two likely medium-term scenarios: "Slow pain" or "fast pain" as a correction creates a bear market.

Their analysis starts from the perspective of a "60/40" portfolio, meaning an investment that is 60% in the S&P 500 Index and 40% in US government bonds — a typical blend you'd see in any private pension mutual fund or 401(k) plan. It's exactly the type of investment you are likely to be relying on to retire, in other words. Bonds are usually used as a hedge against stocks because they often hold their value when shares tumble.
"The current valuation percentile is most comparable to the late 20s, which ended in the 'Great Depression'"

But that extended runup since 2009 — nearly nine years with a correction — has created a scenario last seen right before the Great Depression in the early 20th Century, the Goldman team says:

"The favourable macro backdrop has boosted returns across assets, driving a 'bull market in everything', despite and because there has been little inflation in the real economy. But as a result, valuations across assets are expensive vs. history, which reduces the potential for returns and diversification ... And elevated valuations increase the risk of drawdowns for the simple reason that there is less buffer to absorb shocks. The average valuation percentile across equity, bonds and credit in the US is 90%, an all-time high. While equities and credit were more expensive in the Tech Bubble, bonds were comparably attractive at the time. The current valuation percentile is most comparable to the late 20s, which ended in the 'Great Depression.'"

Here is the historical perspective:

G

Good luck!

Bubble Watch: US Margin Debt Now Equal the Economy of Taiwan

When Central Banks attempted to corner the sovereign bond market via ZIRP and QE, they forced ALL risk in the financial system to adjust lower.

Remember, in a fiat-based monetary system such as the one used by the world today, sovereign bonds NOT gold are the ultimate backstop for the financial system.

And for the US, which controls the reserve currency of the world, sovereign bonds, also called Treasuries, represent the "risk-free" rate of return for the entire world.

So when the Fed moved to corner this market, forcing the yields on these bonds to drop to all-time lows, it was effectively forcing ALL risk in the US financial system to adjust to an abnormal risk-profile.

Put simply, the Fed created a bubble in bonds, which in turn fueled a bubble in everything.

Yes, everything… corporate bonds, municipal bonds, stocks, even consumer credit. Indeed, nine years into this insanity things have reach such egregious levels of excess that even tertiary debt instruments such as margin debt have reached levels greater than ever before.

What is margin debt?

Margin debt is money that stock investors borrow in order to buy stocks. It is direct leverage. And it just hit a new record… or $561 billion.

To put this number into perspective, it is:
Equal to the entire economy of Asian powerhouse Taiwan.
Nearly greater than the amount of margin debt borrowed at the peak of the last bubble in 2007 50%.
DOUBLE the amount of margin debt borrowed at the peak of the Tech Bubble.

Now, no one in their right mind would argue that late 2000 or late 2007 were periods of fiscal restraint.

Well, today investors are borrowing hundreds of billions or dollars MORE to invest in the stock market than they were at those times.

The bubble in bonds is what finances this entire mess. By creating a bubble in bonds, the US Federal Reserve has created a bubble in EVERYTHING because borrowing costs are at absurdly low levels.

This is why the term The Everything Bubble is used since 2014. It's also why many things has been written on this issue as well as what's coming down the pike: because when this bubble bursts (as all bubbles do) the policies Central Banks employ will make those from 2008-2015 look like a cakewalk.

The ECB Comes Clean On Rising Rates and the Coming Systemic Reset

Remember how the Fed, ECB and others all claimed ZIRP and QE were about generating economic growth, making mortgages more affordable, and helping consumers?

Well, that was a gigantic lie. The truth is that every major policy employed by Central Banks since 2008 have been about one thing…

Maintaining the bond bubble.

Governments around the world have used the bubble in bonds to finance their bloated budgets. If interest rates were anywhere NEAR normal levels, most countries would lurch towards default in a matter of weeks.

If you think this is conspiracy theory, consider that the European Central Bank openly admitted this in its semi-annual Financial Stability Review this week:

Even so, [the ECB] said that "higher interest rates may trigger concerns about sovereigns' debt-servicing capacity," and noted that "distrust in mainstream political parties continues to rise, leading to fragmentation of the political landscape away from the established consensus."

Source: Bloomberg.

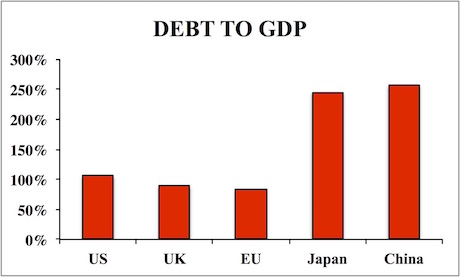
In plain speak, the ECB is admitting here that if rates were to rise, the financial world would quickly realize that most countries couldn't finance their debt payments. Indeed, the five largest economies in the world are all near or above Debt to GDP levels of 100%


The bubble in bonds is what finances this entire mess. It's what lets the political class continue to spend money the government doesn't have. And it's why the entire financial system is now in a bubble.

Remember, sovereign bonds are the bedrock for the current fiat-based financial system, so when they go into a bubble, EVERYTHING goes into a bubble, as all risk assets adjust to ridiculously cheap interest rates.

This is why the term The Everything Bubble is used since 2014. It's also why many things has been written about this issue as well as what's coming down the pike: because when this bubble bursts (as all bubbles do) the policies Central Banks employ will make those from 2008-2015 look like a cakewalk.

2018 Will Be When Central Bank Policy Crashes Into the Wall

The bubble in sovereign bonds is looking dangerously close to popping.


And ironically, what could burst it is the very thing Central Banks have been pursuing aggressively for the last 9 years: inflation.

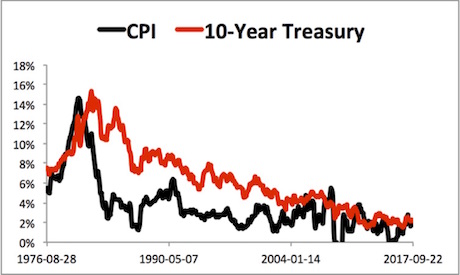
As known, Treasury yields adjust to account for inflation. The relationship is not perfect as bonds are also priced based on economic activity. However, the fact remains, if the rate of inflation spikes, Treasury yields rise as well to account for this.

You can see this in the chart below:


Put simply, if inflation rises, so do Treasury yields.

This in turn means Treasury prices will fall (bond prices fall as yields rise).

And that is a HUGE problem for the Federal Reserve.

The entire reflationary move in the financial system since 2008 was based on the Fed creating a bubble in US Treasuries or sovereign bonds. The Fed did this by cutting rates to zero, pulling down the short end of the bond market. It then targeted the long end of the market with QE programs.

Put simply, the Fed tried to corner the Treasury market, thereby creating a bubble in the most senior asset class in the US financial system. But in order for the Fed to create this bubble, it had to print a massive amount of money ($3.5 trillion or so).

Between this, and the Fed maintaining Zero Interest Rate Policy (ZIRP) for seven years, the Fed unleashed inflation. It's taken longer than one would expect, but it's finally here.

As I write this, the Fed's official inflation metric, the CPI, is already clocking in above the Fed's target rate of 2%.

Similarly, the Fed's "Sticky CPI" which measures price movements in assets that are slow to adjust to inflation, is clocking in over 2%.

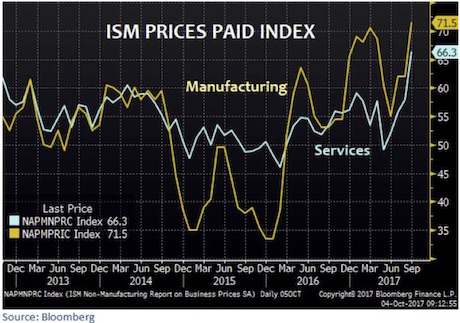
The ISM Prices Paid Index (a survey for managers in the corporate sphere) also shows a spike in both manufacturing AND services prices.


This is critical as it shows that not only is inflation translating into higher prices on manufactured goods, but it also shows that even the services side of the economy is recognizing the threat. Put simply, the cost of everything is rising.

Indeed, this is finally translating into higher wages in the corporate arena (hourly wages are now clocking in at nearly 3%). This is particularly critical because once workers are demanding higher wages due to higher costs of living (inflation) it means that inflation is now firmly entrenched in the economy.

U.S. government debt yields jumped Friday after metrics in the latest Labor Department jobs report showed budding signs of inflation. The closely watched average hourly wages figure rose by an annualized 2.9 percent, a faster pace than the Federal Reserve's 2 percent target for inflation.

Source: CNBC

Put simply, inflationary pressures are on the rise. And they are going to implode the bond market unless Central Banks step back from the endless money printing.

martedì 5 dicembre 2017

Bank of Japan Tapers (Quietly), QE Party Over. - No flashy announcement, to avoid alarming the markets.

After years of blistering asset purchases, the Bank of Japan disclosed today that it held a total of ¥521.6 trillion in assets as of November 30, including Japanese Government Bonds (JGBs), gold, corporate bonds, Japanese REITs, equity ETFs, loans, etc. That is quite a pile, so to speak. It amounts to about 96% of Japan's GDP.

By this measure, the BOJ's balance sheet dwarfs the Fed's balance sheet, which amounts to 23% of US GDP. When it comes to QE, no one can hold a candle to Japan. Its holdings of JGBs alone rose to ¥443.6 trillion. Its balance sheet looks like a typical post-Financial-Crisis central-bank balance sheet on steroids (chart in trillion yen):


There a couple of differences compared to other central banks: One, the BOJ started QE long before anyone even called it "QE," but in 2013, it really got going, and those giant moves made the prior periods of QE look minuscule. And two, the BOJ actually unwound some of its earlier QE starting in late 2005 but soon gave up on it.

Now something else has been happening: Starting in December 2016 – the month the Fed raised rates and a few months after some Fed governors started to kick around the idea publicly that QE should be unwound – the BOJ began to curtail its asset purchases.

In other words, it began to "taper." Assets are still increasing but at a much slower rate. During peak QE – the 12-month period ending December 31, 2016 – it added ¥93.4 trillion (about $830 billion) to its balance sheet. Over the 12-month period ending November 30, 2017, it has added "only" ¥50.8 trillion to its balance sheet. Though that's still a good chunk of money (about $450 billion), that addition is down 46%.

This chart shows the 12-month change in the balance sheet in trillion yen, going back to the Financial Crisis:

In terms of percentage change, the tapering is even clearer. In early 2014, the BOJ exploded its balance sheet by 47% year-over-year. In November 2017, the year-over-year increase was just 10.8%:

The BOJ has used QE as a politically correct pretext to bring Japan's public debt under control by effectively removing JGBs from the market, thus strangling the market, in order to prevent a debt crisis – the kind of mess that happened to Greece.

And it didn't have a lot of other options: By the end of 2016, Japan's national debt had reached 250% of GDP, by far the highest in the world. By comparison, the US gross national debt just hit 105% of GDP. Between the BOJ's vast JGB holdings, and the JGB holdings of state-owned institutions, such as the Government Pension and Investment Fund, Japanese authorities now control the majority of Japan's national debt.

But it seems that the BOJ thinks that this might be about enough. And it has tapered its purchases.

The Fed leads, other central banks follow. But the BOJ follows no one. It's in a universe of its own, given the debt that Japan has to deal with. Nevertheless, it has been tapering in the Fed's tootsteps, while the Fed has been removing accommodation.

Similarly, the ECB began tapering in April 2017, reducing its monthly purchases from €80 billion in prior months, to €60 billion. And on October 26, the ECB decided to taper further, reducing its monthly purchases to €30 billion. But unlike the Bank of Japan, the ECB communicated this tapering via announcements and press conferences that were plastered all over the media, after preparing the markets for months for these announcements.

So the QE booze that the financial markets of those three economies — and of the rest of the world — have gotten drunk on is running low and will soon run out. And then it's hangover time.

In the US, the Fed is considering the tax cuts and "elevated asset prices."

START NOW… TAKE THE RED PILL.


The Red Pill and its opposite, the blue pill, are popular cultural symbols brought to attention in the movie The Matrix, representing the choice between:

Knowledge, freedom and the (often painful) truths of reality (red pill)
Falsehood, security and the blissful ignorance of illusion (blue pill)

Everything connected is written for investors as a wakeup call – or red pill – regarding the state of today's markets and split into three sections:
Asset allocation – why what used to work won't in the future.
The three major proponents of this change and risks/opportunities they bring 
Time-horizons for investors for the scenarios discussed playing out

lunedì 4 dicembre 2017

"For The First Time In Modern History" US Government Debt Will Surpass Household Debt


Last week, rating agency DBRS raised a red flag when it calculated that in the past decade average US wages have risen by only 5.7%, while consumer debt over the same period rose 60% more, or 9.3%. However, while the US household's reliance on debt to fill in the income gaps is hardly news, on Monday JPMorgan found another, even more concerning debt inflection point: household debt, fast as it may be rising, is about to be eclipsed for the first time ever by the even faster rising federal government debt.

As JPM writes in its weekly market recap, prior to the Financial Crisis, household debt relative to federal government debt hit a high of 3 to 1 times. Since then, a combination of bank credit  tightness and consumer prudence has sharply limited the growth in household debt, with liabilities increasing just 4% since 3Q 2008. However, JPM adds, "the same cannot be said of the federal government, with liabilities increasing almost 150% over the same period and nearly reaching household debt levels for the first time in modern history." 

JPM continues:

On top of that, the CBO projects that, even excluding the impact of tax cuts, government debt levels will continue to march upward over the course of the next 10 years, ultimately hitting $25.5 trillion by the end of 2027. 

While this does not point to an impending crisis, it does mean that, should another downturn occur, the government would be far less able to come to the rescue as it did in 2008. It also means that while tax cuts may take place today, it becomes all the more probable that they will become tax increases or spending cuts in the future, with tax increases likely to hit higher income households and elderly households being more vulnerable to spending cuts.

Finally, "this means that while consumers have taken steps on their own account to ensure a smaller debt burden, older and wealthier households should be particularly wary of the potential impact of rising government debt on their finances" especially once the next government - far more likely to be of the "wealth redistribution persuasion" - decides to do just that..

Schumer, Pelosi Will Meet With Trump To Negotiate Government Funding One Day Before Deadline

After last week's snub, when Nanci Pelosi and Chuck Schumer pulled out of a meeting scheduled with Trump when the president tweeted that he was sitting down with "Chuck and Nancy" but that he didn't "see a deal", it appears that there has been no bad blood between the president and the top Democrats, because on Monday afternoon Chuck and Nancy said they would head to the White House on Thursday for end-of-the-year negotiations and avoiding a government shutdown this week. 

"We're glad the White House has reached out and asked for a second meeting. We hope the President will go into this meeting with an open mind, rather than deciding that an agreement can't be reached beforehand," the two Democratic leaders said in a joint statement. They added that they "are hopeful the President will be open to an agreement to address the urgent needs of the American people and keep government open."

In addition to the Democrats, top Republicans Mitch McConnell and Paul Ryan, who attended last week's meeting with Trump alone, are expected to be at Thursday's powwow. 

The meeting is scheduled for one day before the Dec. 8 deadline to fund the government, which means that any potential complications could result in an abrupt - if temporary - government shutdown. 

As reported previously, House GOP leadership is pushing forward with a plan to pass a two-week short-term spending bill as soon as Wednesday, the same as Senate GOP leadership which is also backing the two-week stopgap strategy. 

Democrats have yet to take a position on passing a two-week "clean" continuing resolution. Since their votes will be needed to avoid a shutdown, Democrats will hold the leverage: in addition to a short-term deal, Schumer and Pelosi noted they also need to reach a budget agreement, as well as fund the Children's Health Insurance Program (CHIP), pass more disaster relief aid and address a key Obama-era immigration program. 

As part of their demands, the duo said that the funding deal must boost spending for military and domestic priorities equally, and also calls for bipartisan agreement on Dreamers along with border security measures. 

This may be a problem, and another problem will the Freedom Caucus which as Politico's Jake Sherman reports, is getting itchy and "holding meeting before votes tonight as they opposed to gop leadership govt funding strategy."