MARKET FLASH:

"It seems the donkey is laughing, but he instead is braying (l'asino sembra ridere ma in realtà raglia)": si veda sotto "1927-1933: Pompous Prognosticators" per avere la conferma che la storia non si ripete ma fà la rima.


lunedì 6 novembre 2017

The Central Bank Bubble: How Will It Burst?


Alberto Gallo of Algebris Investments steps up to take his shot at the $64,000 (more like trillion) question in a report published this week "The Central Bank Bubble: How Will It Burst?"

Gallo manages the Algebris Macro Credit Fund described as "an unconstrained strategy investing across global bond and credit markets, and with lead responsibility for Macro Strategies" on the company's website.


Gallo sets the scene as follows.

Most investors are still playing the game, and in the same direction. We estimate there are currently around $11tn in negative-yielding bonds and over $2tn in strategies that explicitly or implicitly depend on stable volatility and asset correlations. If low interest rates and QE have been the lever pushing up prices of dividend and coupon-paying assets, central banks are the fulcrum.

This fulcrum is slowly shifting: the ECB has just announced a reduction in its bond purchase programme, the Bank of England is likely to hike this month – even in the face of economic weakness –the Fed will likely hike rates again in December, and the PBoC has recently warned of asset overvaluation. One of our favourite parts of the report is "The Magic Money Tree" infographic which explains how QE has benefited a plethora of investment strategies and created the current bubble to end all bubbles.


Now Gallo is obviously savvy because he doesn't nail his colours to the mast on one factor which will prick the central bank bubble. Instead he offers four scenarios. The first threat is a rise in inflation, which he summarises as follows.

1. Inflation: after nine years of low-flation, the probability of a sudden rise in inflation is increasing, as job markets get tighter, globalisation leaves way to protectionist policies and liquidity reaches job-creating small and medium businesses as banks re-start lending.

Wage inflation aside, Gallo believes China could continue to export inflation based on a more resilient than expected Chinese economy. Gallo believes that China may have sufficient policy options to smoothly deflate its credit bubble. While we might disagree, it is a possibility.

The second threat to the central bank bubble is…central bankers.


2. Central bankers themselves: central banks appear to have shifted their tone to worry increasingly about financial stability. There are good reasons to do so. We are many years into a global synchronous expansion, and there will be little monetary policy ammunition to fight a new slowdown, with interest rates near record lows and $20tn in global central bank balance sheets. In some countries, like Japan and Switzerland, central banks have grown their balance sheets to sizes similar to their respective economies. The good news is some central banks are trying to curb stimulus before their mandate ends. The Federal Reserve is poised to raise rates again in December, the Bank of England will likely hike, the ECB has announced a reduction in purchases and the Bank of Canada has hiked too. The bad news is that markets have so far largely ignored this reduction in stimulus.

It makes sense…central banks created the bubble via QE and ZIRP/NIRP, so reversing that strategy might prick their own bubble.

The third threat is another merry band of miscreants.

3. Politicians: central bank QE has not only lowered yields and boosted asset prices. It has also artificially suppressed volatility. Yet volatility may come back as the consequences of rising inequality in the distribution of wealth, opportunity and natural resources across the world. The last decade has been great for billionaires, not so good for Main Street. Inequality of wealth and opportunity in developed economies has fuelled anti-establishment protest votes like the ones for Brexit or President Trump. Other populist parties are on the rise in Continental Europe and Scandinavia. In turn, domestic populism and nationalism in developed countries can increase commercial conflict and protectionism - see for instance the potential withdrawal from NAFTA, or the EU-UK tariff threat - as well as exacerbate militarism and geopolitical conflict. Populism has historically fuelled government spending and fiscal stimulus, higher taxes and aggressive redistribution policies, which could all re-price overvalued assets and/or target assets used as a store of value. 

We have nothing to add.


4. The market: rising growth, low inflation and low interest rates have proven a boon to global markets. There are now $20tn in central bank assets globally, and around 10% of global sovereign debt is yielding negative. Investors have been buying equities for yield and bonds for capital gains, and have been selling volatility explicitly or positioned in strategies that are implicitly short volatility. These assume a stable volatility and correlation among the price of assets. For example, risk-parity strategies assume a negative correlation between risky assets, like stocks, and "risk-free assets", like U.S. treasuries. But what happens if both decline together, and short volatility investors become forced to unwind their portfolios?

Exactly, this is what we're waiting for, but what is the catalyst? Nobody knows.

If we were forced to guess what will prick the bubble, we would probably place more emphasis on China than the Algebris report does. However, putting aside what causes it, we share Gallo's view on some of the key mechanics which will be "in play" when a crisis unfolds.

What will the next crisis look like?

The over $2tn in explicit and implicit short-volatility strategies could be the spark, similar to sub-prime for credit markets in 2008, which was $1.4tn. However, a future crisis would be very different from 2008. Growth in passive investing vehicles and in the mismatch between assets they buy and liabilities they issue, lack of risk-free assets and growing collateral chains, diminishing trading liquidity due to higher capital requirements for dealers point to more fragility in financial markets.

It's perfectly set up.

Financial Storm Clouds Gather Over Italy

Wishful thinking may not be enough.

The financial markets have been exceedingly calm in Italy of late. At the end of October the government was able to sell €2.5 billion of 10-year debt at auction at a yield of 1.86%, the lowest since last December — an incredible feat for a country that four months ago witnessed a major bank bailout and two bank resolutions, and that has so much public debt that it spends €70 billion a year to service it, the world's third-highest.

And there's the ECB's recent decision to slash its bond buying from roughly €60 billion a month to €30 billion as of Jan 1, 2018. Then there's the over €432 billion of Target 2 debt the government owes the ECB, the growing likelihood of political instability as elections approach in 2018, the recent referendums for greater fiscal and political autonomy in Lombardy and Veneto and serious unresolved issues in the banking sector.

Monte dei Paschi di Siena may still be alive as a bank, but it's not out of the woods. Last week its stock resumed trading after ten months of being suspended from Italy's benchmark index, the FTSE MBE. Shares opened on Wednesday at €4.10, then rose 28% to €5.26. But it didn't stick. On Friday, shares closed at €4.58.

It's a far cry from the €6.49 a share the Italian government paid in August when it injected €3.85 billion into the bank to keep it alive. It spent another €1.5 billion shielding some of the bank's junior bondholders, whose debt was converted into equity. As part of the rescue, the Tuscan bank was forced to present a plan to cut 5,500 jobs and close 600 branches until 2021, in addition to transferring 28,600 million euros in unproductive loans and divesting non-strategic assets. Investors clearly have their doubts.

In Veneto the situation is, if anything, even bleaker as over 40,000 businesses have been left starved of credit following the impromptu resolution of the region's two biggest banks, Popolare di Vicenza and Veneto Banca.Bloomberg:

While Intesa Sanpaolo SpA, Italy's second-largest bank, paid a symbolic sum to acquire the healthiest parts of the two Veneto lenders, the state entity that's absorbing the 18 billion euros ($21.3 billion) of troubled debt the banks amassed, called SGA, isn't fully operational yet. That has left small and midsized companies in the lurch—in many cases unable to do business.

"Many of these borrowers are profitable companies, but they're stuck in limbo," said Mauro Rocchesso, head of Fidi Impresa e Turismo Veneto, a financial firm that provides collateral to companies seeking lines of credit. "They don't have a counterparty anymore and can't find fresh capital from a new lender because of their exposure to the two Veneto banks."

It's not just businesses and investors that are losing faith in Italy's financial sector; so too is the public. Just 16% of Italians still have confidence in the country's lenders, according to a poll by the SWG research group of Trieste on Friday.

Trust in the Bank of Italy is also in decline, having plunged from 36% in June to 24% in October. Such widespread public mistrust didn't stop the national central bank from awarding the bank's governor, Ignazio Visco, another six-year term after presiding over the worst banking crisis of a generation.

The Bank of Italy's reputation was further dented this month after documents presented in a Milan court case revealed that Italy's central bank knew that MPS' management had papered over a loss of almost $500 million in 2010 and failed to report it. At the time the governor of the Bank of Italy was Mario Draghi.

Now, as chairman of the ECB, Draghi is in charge of withdrawing the QE monetary punch bowl upon which many peripheral EU economies have grown dependent to keep servicing their debts.

Saddled with one of the biggest public debt mountains on the planet, Italy is particularly vulnerable to this change in policy. Even after three years of QE, Italy's economy is growing at a rate of 1.5% a year — good for Italy, but still the worst in Europe. Once the the ECB stops snapping up Italian debt over the coming years, the southern European nation will almost certainly struggle to find buyers for its government bonds.

The ECB has purchased €300 billion ($353 billion) of Italian bonds under its QE program, which is more than three times the net bond issuance for the country during that period, according to Christian Schulz, European economist at Citigroup. That means the ECB has not only bought pretty much all new bonds issued in Italy since 2015, but also existing bonds from other investors.

As the ECB cuts its purchases by roughly half in two months' time, those investors, including foreigners, Italian households and Italian retail investors, will have to come back into the market in a big way; otherwise the yields on Italian bonds will begin soaring, driving up the costs of funding for the government.

Once the ECB stops buying Italian bonds altogether, the only way for the game to continue is — according to research by Alleston Capital — if over the following six years non-banks increase their purchase activity up to seven times that of the past nine years. But these are the very investors who, via QE, were eager to offload the risks of Italian liabilities onto the Bank of Italy, and then onto the Eurosystem.

It's a long shot, to put it mildly.

But Luca Cazzulani, deputy head of fixed-income strategy at UniCredit in Milan, doesn't seem unduly fazed. "Because there has been a net transfer of bonds from private investors to the ECB, it must mean that the private investors now own less compared to before the QE program started," he said. "There should be room for these other types of investors to step back to sort of restore what they originally had." Now that is what you call wishful thinking.

domenica 5 novembre 2017

U.S. Pension Assets Up, But So, Too, Are Liabilities


With the aging of America comes increased pension fund liabilities, a topic which has been top of mind for fund managers. A recent Milliman study shows the double-edged sword of such plans, which have higher funding ratios but also increased liabilities. The reach for yield in a low-interest rate environment has, in part, caused funding ratios to move lower as the deficit between growing liabilities and available assets climbs to a new study high.

Good news in Millman study is that aggregate funding ratios and pension assets are up, the bad news is that liabilities are up, too

The good news in the Milliman Public Pension Funding Study is that the estimated aggregate funded ratio is up to 70.7%, up from 67.7% on a year over year basis. Total assets in the nation's largest public pension plans rose from $3.19 trillion, and as of June 30, 2017, to a combined $3.44 trillion, a feat that Milliman attributes to "strong market performance in late 2016 and early 2017."

The gains come as many pension plans are lowering their return assumptions. The Employees Retirement System of Texas, for instance, lowered its return assumption from 8% to 7.5% in the headwind of some on the board who advocated for a 7% return assumption.

Lowering of returns expectations comes as the median average returns assumption in the Milliman report is 6.71%, off 79 basis points from the 7.50% median discount rate used by the plans. All but six of the plans in the Millman study have a lower independently determined rate.  One-third of the 100 largest plans reduced return assumptions, with 66 of the 100 plans lowering them at least once since 2012.

The lowered returns expectations come as total pension liabilities are rising, up to $4.72 trillion in 2016 from $4.42 trillion. The 2017 number is expected to clock in at $4.87 trillion. The 26 million members who rely on the plans for retirement each have a $224,000 cost assumptions. Nine of the plans have higher funded ratios in excess of 90%, 59 have funded ratios between 60% and 90% while 32 plans have ratios below 60%.

In the 2017 study, the aggregate reported funded status hit a record deficit of $1.53 trillion, down from a low of $1.02 trillion in 2015 and also higher than the 2018 study estimate of a $1.43 trillion deficit.

"In this low-interest-rate environment, market expectations on investment returns have been falling faster than plan sponsors can reassess rates," Becky Sielman, author of the report, said in a statement.  "And the gap that creates between sponsor-reported and our recalibrated market-based liabilities is widening, which is all the more reason plans should continue to monitor emerging investment return expectations and adjust their assumptions as needed."

Risk exposure has not been increasing

When pension funds look at their investment horizon, the impact low-interest rates and the resulting search for yield is apparent. US Fixed Income accounts for 21.8% of the average 2017 asset allocation, while US equities gobble up 28.3% while non-US equities occupy 19.1% of the portfolio. Other assets tied to the performance driver of economic strength include real estate, which has an 8.8% exposure while Private Equity has a 9.9% exposure. Hedge funds, initially designed to hedge during periods of market turbulence, have a 5.1% exposure.

Over the past five years there has been very little change in the overall allocation mix, the report noted. Pointing to a reach for yield that hasn't resulted in a correlated rise in risk factors, the report noted that over the past four years "there has not been a material move towards riskier investments."

Since 2013, equities generally made up near half the total portfolio, while private equity and real estate clock in at near one quarter along with fixed income.

Today’s Three Important Megatrends


When Peter Berezin, Chief Global Strategist at BCA Research, looks at three largely non-consensus megatrends shaping society, he doesn't engage in "happy talk," as he describes it. He sees global migration with open borders for skilled workers benefiting the developed world, but also notes that if the delicate issue is not properly managed rising economic stability. He considers social fragmentation that is rife across the developed world brandishing a populist flag and sees the unanswered rage as threatening democracy itself, which millennials don't seem to particularly care for anyway. Then he looks at aging trends across the developed world and doesn't think deflation, but rather inflation.

This isn't likely to be good for the business climate.

Providing open borders for skilled workers benefits an economy, but not unskilled workers

There are many trends that appear to unite a rage that is spreading around the developed world, with immigration being a key hot button.

If properly managed, however, open immigration can benefit a society.

Pointing to several studies that concluded the removal of all restrictions on labor mobility would more than double global GDP in advanced economies, Berezin notes a double-edged sword. Migration is a net economic positive in the developed world when they are educated and have useful skills. "The problem is that many migrants today are poorly skilled," he writes, a trend that has been documented in Germany to various degrees.

Looking at the issue from an unemotional, economic angle, Berezin recognizes the political powder keg. He observes that opening up borders to labor can hurt the existing unskilled labor force, forcing wages lower. Allowing for unfettered migration for the most skilled workers, however, further creates a global society of haves and have nots, which likely isn't expected to end well for capitalism in the long run.

Social fragmentation and class division hurts all

There is a trend of social fragmentation that can be seen, in part, through the eyes of open borders. Such measures create a further economic divide between the skilled and educated and the unskilled.

Further societal fragmentation and a deep, darker divide among social classes, which has a multi-facetted performance driver. He notes on the left the harang for income inequality is fraying society while on the right calls that "cultural elites" no longer instill middle-class values has resulted in "underclass" behavior being normalized.

It is not just open borders that divide society, but technology, a cause for recent Congressional hearings, that is exacerbating social fragmentation.

The internet is not expanding people's minds through divergent thoughts but rather "has allowed like-minded people to self-segregate into echo chambers where members of the community simply reinforce what others already believe."

The problem with social fragmentation is that a lack of a common value system, when divergent demographics no longer see eye to eye, is that established institutions lose legitimacy. Berezin notes that that has resulted in a collapse of trust in the media, particularly among right-leaning voters, and "most worrying, support for democracy itself has dwindled around the world."

Aging is inflationary, not deflationary

Looking at demographic trends, younger "millennials" don't think living under a democratic form of government is essential.

The youth trend could see a reversal of several trends, including the one that keeps urban areas vital. If the trend towards less crime is reversed -- as it has in Chicago -- young people could leave urban areas in droves.

While the trend for a population has at times been associated with deflation, Berezin thinks the opposite might occur. Spending increases as population ages.

He notes an approaching "inflection point" where aging trends morph from being deflationary to inflationary. This is largely due to the global trend of the "support ratio -- the ratio of workers to consumers – peaking after a forty-year climb. Ultimately this could lead not to deflation, but inflation.

The market’s ‘fear gauge’ says it’s time to worry


The market's 'fear gauge' says it's time to worry

As all experienced investors know, October is a month to be wary of. That's because – as history has already shown – it's a time when stock markets like a good crash.

Except that this is 2017, and equities are playing a different game. They don't want to fall any more. Maybe overall price levels will drop a couple of per cent once in a while, but that's about it.

Right now, America's S&P 500 index appears to be leading global share indices into a nirvana of ever-rising corporate worth.

Regardless of any adverse news, it seems as though investors are no longer concerned they might lose money according to the stock market's 'fear gauge'.

And this is when we really should start worrying…

Asset price inflation

Why do stocks keep climbing?

Following the Great Financial Crisis (GFC) that began almost a decade ago – and was made worse by some 'clever' derivative instruments that went horribly wrong as I wrote about here – the world's top money men resolved to prevent another panic on their watch.

Deflation, i.e. a fall in prices, became the bogeyman. Central bankers, however, decided they could both 'solve' the GFC whilst simultaneously preventing another by creating oodles of extra cash.

After all, throw enough money at anything and eventually its price must rise. 

So the people running the US Federal Reserve, the Bank of Japan, the European Central Bank and the Bank of England did just that.

They gave it a pseudo-technical term: quantitative easing (or QE) but in essence, they simply cranked up the money-printing presses.

Central bankers can't, of course, actually resolve any real problems this way, as I examine lower down. In fact, they didn't even put their monetary sticking plasters in the right place.

Rather than raising high street prices, they ended up hiking the cost of assets such as property and stocks. Which is why if you don't already own your own house you probably can't afford to buy one and why the S&P 500 index just keeps on rising.

Not on much bigger profits – that's definitely not happened – but on increasingly over-extended valuations.

Put another way, investors are happy to pay ever-higher prices for exactly the same companies as before, just because interest rates are so low.

The 'fear index' tells the story

The bottom line is that the investment fret factor scarcely still exists. The US equity market has become hugely complacent about the risks of owning shares.

I'm not saying this simply because of the surge in the S&P 500.

You can also look at the VIX, otherwise known as the US market's 'fear gauge'.

Apologies for the nerdy stuff: VIX is the ticker symbol for the Chicago Board Options Exchange (CBOE) Volatility Index.

It's constructed using implied volatilities – the chances of price moves – of a wide range of S&P 500 index options. Specifically it shows the market's 30-day volatility forecast.

In simpler terms, the VIX measures the anticipated risk of being invested in America's equity market.

High volatility is seen as bad, low is good.

Over the last 20 years the VIX has traded between 80 (expected very risky, like nine years ago in mid-GFC) and just below 10 (expected very low risk).

By now you've probably worked out where the VIX is currently standing.

For most of 2017, it's been around the 10 area. In other words, it's already tested the troughs of the last decade but now the VIX has dropped to levels seen in March 2007…in fact, just before the GFC! Here's the 10-year VIX picture:

Can you believe it? 

Calling this extreme complacency is an understatement. Once again it seems that many shareholders simply haven't a clue how much risk they're taking.

For one thing, US equities may already be in bubble territory. That would spell big danger, even without all the bad news around and geo-political tensions are arguably their highest levels for years.

And remember what I said about those central bankers not solving the GFC? Well, their efforts have made things much worse.

Indeed, to drag itself out of a debt/deflation downward spiral, the world created lot of extra borrowing. Worse, even more debt exists than we previously thought.

The Bank of International Settlements is often called 'the bank for central banks'. After my earlier comments about central bankers, that might not sound too promising. However, I'd rate the BIS as one of the good guys. The bank is great at number crunching. And it doesn't pull any punches. So when the BIS speak, I listen.

And last month the bank gave a very scary warning:

"Global debt may be under-reported by around $13 trillion because traditional accounting practices don't include foreign exchange derivatives that are used to hedge international trade and foreign currency bonds", reports Reuters.

Aargh! More jargon. But you don't need to be an accountant to see the word 'derivative'. Financial weapons of mass destruction, as Warren Buffett once called them can be lethal in the wrong hands.

"Bank for International Settlements researchers said it's hard to assess the risk this 'missing' debt poses", says Reuters. "But the main worry [is] a liquidity crunch like the one that seized FX swap and forwards markets during the financial crisis".

And all the while, the VIX is saying there's less need to panic than ever.
In truth, I find it hard to envisage $13 trillion, and then I looked at the latest BIS chart on overall global debt (see below). The bank's 2017 worldwide estimate is now a completely mindboggling $217 trillion.

That's no less than 327% of world GDP!

The scope for something to go wrong has to be…well, I'll leave it to you to finish the sentence. Yet to repeat, S&P 500 investors are still at their most complacent.

So, the burning question now is; what next?

Well, if you are looking for an opportunity to take advantage of all of this uncertainty, my colleagues Jim Rickards and Tom Tragett might be able to help you.

You see, they've examined the outlook for markets over the coming months and spotlighted many of the risks, as well as looked at what to avoid. Finally, they've found a Big Trade for 2018 that they believe will be even bigger than any move in gold – the traditional safe haven in troubled times.


Fabrizio 

sabato 4 novembre 2017

The Fed Actually Begins its QE Unwind

But what's happening with mortgage-backed securities?

Thursday afternoon, the Fed released its weekly balance sheet for the week ending November 1. This completes the first month
of the QE unwind, or "balance sheet normalization," as the Fed
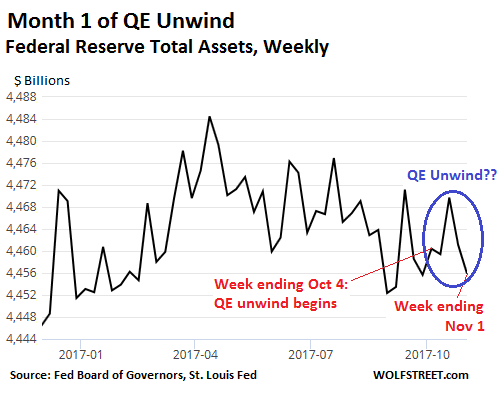
calls it. But curious things are happening on the Fed's balance sheet. On September 20, the Fed announced that the QE unwind would begin October 1, at the pace announced at its June 14 meeting. This would shrink the Fed's balance sheet by $10 billion a month for each of the first three months. The shrinkage would then accelerate every three months. A year from now, the shrinkage would reach $50 billion a month – a rate of $600 billion a year – and continue at that pace. This would gradually destroy some of the trillions that had been created out of nothing during QE. Over the five weekly balance sheets since the QE-unwind kick-off date, total assets rose initially by $10 billion from October 4 to October 18 and then fell by $14 billion, for a net decline of $4 billion. By November 1, total assets were $4,456 billion:

The Fed is supposed to unload $10 billion in October. Instead it unloaded $4 billion. And the variations from week to week are entirely in the normal range of the prior months.
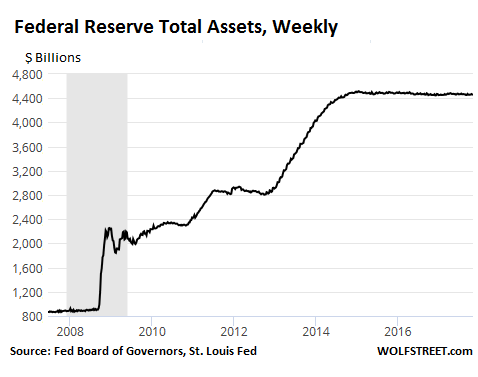
The chart below shows the Fed's total assets since 2007, covering the entire QE period from the Financial Crisis on. The tiny $4-billion decline in October gets lost in the massive table mountain of assets:

BBut a first real step has happened.

As part of the $10 billion that the Fed said it would shrink its balance sheet in October, it was supposed to unload $6 billion in Treasury securities.
The way the Fed undertakes the balance sheet normalization is not by selling Treasury securities outright but by allowing them, when they mature, to "roll off" the balance sheet. In order words, when they mature, the Treasury Department pays the Fed the face value of those securities. Then, instead of reinvesting the money in new Treasuries, the Fed destroys the money. This is the opposite of what it had done during QE when it created the money to buy securities.
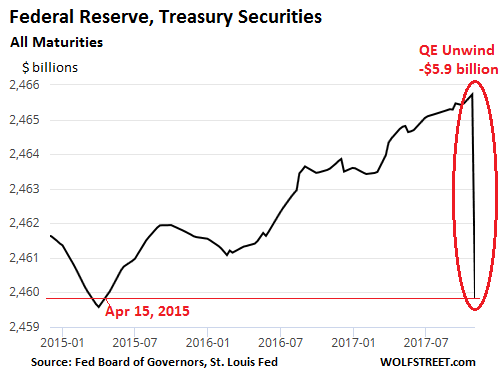
On October 31, $8.5 billion of Treasuries that the Fed had been holding matured. If the Fed stuck to its announcement, it would have reinvested $2.5 billion and let $6 billion (the cap for the month of October) "roll off." The amount of Treasuries on the balance sheet should then have decreased by $6 billion.
And that's what happened. This chart of the Fed's Treasury holdings shows that the balance dropped by $5.9 billion, from an all-time record 2,465.7 billion on October 25 to $2,459.8 billion on November 1, the lowest since April 15, 2015:
So the QE unwind of Treasury securities has commenced.
But mortgage-backed securities?
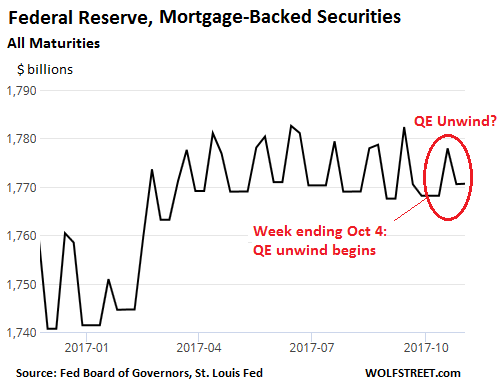
As part of the $10 billion unwind in October, the Fed was also supposed to unload $4 billion in mortgage-backed securities (MBS). How did that go so far?
On October 4, it held $1,768.2 billion in mortgage backed securities. On October 18, this spiked by nearly $10 billion to $1,777.9 billion. Since then, it has fallen by $7.3 billion to $1,770.6 billion, but remains $2.4 billion higher than at the outset of the QE unwind:


Clearly, the Fed has not yet kicked off the unwind of its MBS portfolio. Since the end of QE, the Fed's Open Market Operations (OMO) has continually purchased small amounts of MBS in the market. Residential MBS are different from bonds. They regularly forward principal payments to their holders as underlying mortgages get paid down or off, and the principal shrinks until whatever is left is redeemed at maturity. To keep the MBS balance steady, the Fed has to buy MBS in the market.
And it has continued buying them in October with stoic routine.
This bifurcation – that the QE unwind is happening with Treasury securities but not with MBS – is curious. But MBS take a while to settle, which could explain some of the delay. After the on-target $6-billion drop in Treasuries, however, I'm tempted to think that the QE unwind of MBS will also eventually materialize, and that the overall package will proceed as announced.
For now, the amounts are small. By next year at this time, the QE unwind, if it happens as announced, will proceed at a rate of $600 billion a year, a momentous monetary policy change, partially reversing the effects of QE, including QE's effect on asset prices.
And the surge in asset prices has been a doozie.

The Year Was 1989...

These folks were probably worth more than Justin Bieber.

And this guy was still alive... and even though dressed like a peacock, amazingly popular.

1989 was also the year the Japanese stock market topped out.

Background

Most economic crises are the result of an economic boom which leads to investors getting all giddy, bidding up assets to the point where they become completely disconnected with reality.

Japan in the 70's and 80's was no different. People are people, everywhere and always. Even if they do eat oodles of raw fish and seaweed.

In the 70's, after they'd nicked a lot of German ideas, Japan managed to produce the world's second-largest gross national product (GNP) after the US. And, get this: By the late 1980s, Japan ranked first in GNP per capita worldwide.

Record-low interest rates had fuelled a stock market and real estate speculative boom that sent valuations screaming throughout the 80's. In fact, at one point a piddly little 3-square meter piece of dirt (enough to stick a portaloo on) near the Imperial Palace sold for $600,000. The Imperial Palace itself was worth more than the entire state of California.

If it sounds crazy, it's because it was.

Upon realizing that the bubble was unsustainable and potentially destabilising for the economy, Japan's Finance Ministry ratcheted up interest rates to try and curb the rampant speculation. It was all far too late, and the move quickly led to a stock market implosion and debt crisis as borrowers failed to make payments on debts, many of which were backed by assets which themselves had been bid up in a speculative frenzy and now worth a whole lot less.

In the bloodbath that ensued, Japanese investors lost their shirts kimonos, and the Imperial Palace could no longer be sold to buy George Clooney's Hollywood bathroom.

Fast forward to today and you'd be forgiven for thinking the place was about to be nuked by young Kim, who is more likely to have his shiny rocket wobble about in the sky for a bit before crashing... or not taking off properly at all.

The point is: If you were to run a poll today, you'd probably find that the the perception amongst money managers is that the only folks who've been buying Japanese equities, (which includes us) are ones who've taken a knock to the head or been dropped on their head at birth.

And that's not all.

Bloomberg recently pointed out that less than 10% of Japanese households own any equities. That's basically none. Zero. Zilch. Nada.

Marginal Buyers

Which brings me neatly to another much lovedthesis of mine. It was Mark Twain who said:

"Courage is not the absence of fear; it is acting in spite of it."

Well, I say, risk is not the absence of consensus; it is the deafening roar of it.

So what's the risk today? Well, risk is highest when your pool of marginal buyers are the smallest, and consequently the lowest when your pool of marginal buyers the greatest.

I always look for markets where marginal buyers are either exhausted (none left, everybody is already in) or they're sitting there at the train station watching the rain, just waiting for a reason to board the next train.

Bad News... Pffff

Something else.

I've always looked at turning points in markets and one of the best signs of a stealth bull market I've ever seen is a market which continues to rally on bad news.

And there's been a fair bit of that in the land of the rising sun.

Toshiba — Japan's answer to Enron:

Mitsubishi, after admitting to falsifying fuel efficiency data. Naughty, naughty!

Kobe Steel with their own scandal. Very naughty!

These follow scandals at Nissan, Toyota, and Takata Corp.

And the market? Rallying.

Who Leads?


Another thing I look at is small caps. Why?

Because small caps are like Mahatma Gandhi — they're natural leaders.

Here's the small caps:

One word. En fuego! (Ok, I lied... 2 words).

Not only that. They actually make money and pay shareholders. How unique!

In fact, if like me you're on the lookout for stuff like this you'll realise that this market actually got cheaper over the last decade...while it's gone up. How so?

Dividends grew faster (97.5%) than prices (29.2%), so on a price-to-dividend basis they're even cheaper today... all the while we've been making money.

And for you technical geeks out there, here's something to chew on.

The Nikkei 225 just broke a key 38.2 percent Fibonacci-retracement level. The next retracement of 50% stands at 22,981.49. Today, as I write this we trade at 22,539. Mmmm

So marginal buyers are large. Bad news is being bought not sold. Technicals couldn't be better. Companies actually make money. And today you could buy much of the Japanese banking industry if you were to liquidate Elon's vanity project that incidentally incinerates cash and uses funky math.