MARKET FLASH:

"It seems the donkey is laughing, but he instead is braying (l'asino sembra ridere ma in realtà raglia)": si veda sotto "1927-1933: Pompous Prognosticators" per avere la conferma che la storia non si ripete ma fà la rima.


lunedì 30 ottobre 2017

Fwd: The World's Five Largest Bond Markets Are Syncing Up For Disaster

Another major economy is facing the ugly prospect of rising inflation.
A central theme in our analysis of The Everything Bubble is that Central Bankers are focused on only one thing: maintaining the bull market in bonds at all costs.
The reasons are as follows:
1)   Bonds are what finance the Government's massive entitlement spending/ welfare programs.
2)   With massive ownership of bonds thanks to over $15 trillion in QE, Central Banks are extremely exposed should bonds collapse (and yes, Central Banks can go bust).
With that in mind, we've been guiding our clients to focus on the dangers of rising bond yields due to surging inflation globally. Rising bond yields= falling bond prices. Falling bond prices=the bond bubble could burst.
And a bursting bond bubble= SYSTEMIC reset as entire countries go broke (think Greece in 2010).
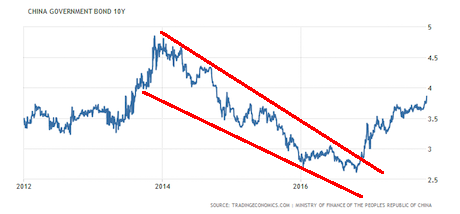
On that note, China is the latest major economy to see its bond yields rise as inflation takes hold.  Yields on China's 10-Year Government bond are breaking out to the upside as I write this.
GPC103017.png

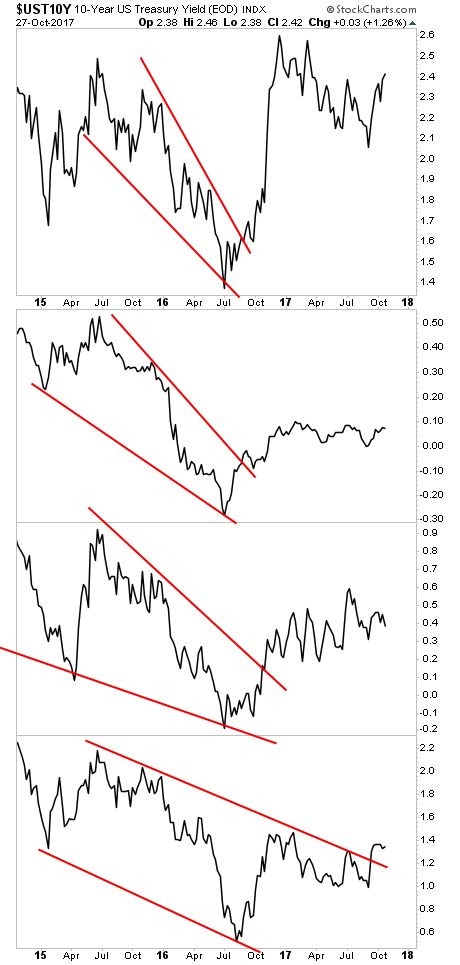
With China now experiencing higher bond yields (higher borrowing costs in the bond market), all FIVE of the world's largest bond markets are warning of rising inflation: the US's, Japan's, Germany's, and the United Kingdom's bonds are all flashing "DANGER" with multi-year breakouts occurring in their 10-year bond yields.
GPC1030172.png
The above chart is telling us in very simple terms: the bond market is VERY worried about rising inflation. And if Central Banks don't move to stop hit now by ending their QE programs and hiking rates, we're in for a VERY dangerous time in the markets.
Put simply, BIG INFLATION is THE BIG MONEY trend today.


--

The "Iron Coffin Lid": Why The Euphoric Surge In Japanese Stocks Is Coming To An End

Last week, Japan's Nikkei 225 index enjoyed its longest winning streak in history which eventually ending after 16 consecutive days of gains, only to resume rising after a brief one day hiatus. And, as foreign investors once again flood the Japanese stock market, chasing the momentum which has pushed local stocks to levels not seen since 1996, the question on everyone's lips is how much longer can this continue?

Offering a decidedly downbeat outlook on Japan's market exuberance, Shannon McConaghy - portfolio manager at what we have in the past dubbed the world's most bearish hedge fund, Horseman Capital Management - believes that the euphoria is about to end. The reason: the ominously sounding "Iron Coffin Lid."

In a note released late last week, McConaghy writes that there has been a lot of excitement over Japanese equities of late, with hyperbole from the sell-side, and others interested in promoting Japanese equities, becoming extreme. However, he cautions that "there is not a lot of discussion around the risks to Japanese equities from current elevated levels" and adds that "one observation I would make is that Japan has risen to these levels on a number of occasions over the last 25 years, only to fail spectacularly each time against what is referred to, by some in the Japan markets, as the "Iron Coffin Lid". History suggests it is far better to be short Japanese equities from these levels than to be long."

So what is this Iron Coffin, why does it have a lid, and what happens next?

Below is a visualization of this "Iron Coffin Lid" effect: it shows the key resistance level in the Topix beyond which the index has failed to progress every time in the past quarter century.


There's more than just a chart however: here is Horseman's take on why this latest rally in Japanese stocks is also set for disappointment.

For those unwilling to outright short, I would point out that historically Japan has had meaningful underperformance following past bursts of outperformance. In these periods it is particularly appealing to short against longs in higher growth areas. Japan also provides amplified short returns during global down turns. As such it can be a low cost but high return hedge to risk-off impacting long positions elsewhere. One way to identify when Japan is about to provide its greatest periods of underperformance is when its market capitalisation exceeds its Gross Domestic Product (GDP). Again, on this measure history suggests it is far better to get short Japanese equities at current levels than to get long.


One way to think about Japan's persistent underperformance is that past market rallies have been quickly frustrated by structurally weaker GDP growth, as opposed to other markets with more sustainable growth. Japan's GDP only grew +1.7% over the last 10 years, a CAGR of +0.169%. It grew even less in the 10 years prior. It is no mere coincidence that the market has failed to break out during decades of weak economic activity. Once again the market is pricing in significant economic expansion to come in Japan but its demographics, the key reason for past structural weakness, are only getting worse. I expect the euphoric hope held by many in the market, that "this time is different" in Japan, will once again be crushed by the "Iron Coffin Lid" that is Japan's structurally weak economy. Long positions in Japan will likely be buried alive again while short opportunities thrive. Yes, Japan's GDP growth rate has been higher since 2012, during what I would consider a recovery phase. But the drivers of growth in the three largest components of GDP growth are unsustainable, exhausted and now showing clear signs of reversing. Our market views to be released over coming days will look into these three major components of recent GDP growth in more detail.


Originating from Horseman Capital, hardly known for its optimistic outlook, here is the fund's take on why Japan is set for more pain once the current euphoria fades, and how to capitalize on this imminent decline:

As a short preview, Japan faces immense risks to its economic system from;

Declining private consumption as the number of households in Japan starts to decline. Nowcast data also shows a marked decline in household consumption in recent months.
A precipitous decline within the financial sector, an often forgotten component of GDP. With the Japan Financial Services Agency now reporting that most regional banks have become loss making in core businesses.
A roll-over in the real estate sector as residential oversupply hits, vacancy rates rise, rents fall, prices declinein some areas and contract ratios indicate more price cuts are coming.
Net export growth, which has been driven by a weak Yen and weak oil prices, faces a risk of the Yen strengthening 22% back to the long run real effective exchange rate, as well as continued oil price rises.

Short opportunities in regional banks, real estate developers, Real Estate Investment Trusts (REITs) and mid-size retailers are particularly appealing. The first three of these sectors, about which we have written over the last two years, have been noticeably weak but still offer significant downside. The retail sector, about which we have only recently began to write, has yet to turn down but was a notably weak performer in the last years of the last global credit cycle. Importantly we believe that shorting these sectors does not require an end to the global credit cycle, but they would likely generate amplified short returns in that environment and hence afford excellent hedges to other longs elsewhere.

Finally, it's worth recalling that as of one month ago, the BOJ already owned three quarters of all Japanese ETFs: a number which is now certainly higher, and is a non-trivial reason why Japan's stocks have enjoyed the recent surge. Of course, with ETF supply declining rapidly and the BOJ soon to be locked out of further purchases, the question is what will stoke further "flow" into risk assets (and frontrunning of central bank purchases), and will the BOJ expand its mandate further to buy single name stocks next in the name of "price stability?"


Global Macro 'Reality' - The Hopium Vs Doomium Model Explained

When Reality and Sentiment Diverge

The Hopium versus Doomium Model

The Hopium vs. Doomium model is initiating today. We first came across the word Hopium in the aftermath of the financial crisis. It was typically used by 'doomers' who believed markets were far ahead of themselves and were betting on hope rather than reality.

This model attempts to pit what we view as reality versus what view as sentiment. The scoring system is partly objective (technical indicating overbought or oversold, fund flows, positioning reports, etc.) and partly subjective (largely me trolling the media and social media trying to uncover true sentiment shifts).

What this is meant to do, is to identify opportunities where sentiment and reality diverge. If sentiment and reality are roughly lined up, then there is no obvious trade to me, but when one is very different than the other, we can identify underweight or overweight opportunities (or even long vs short ideas depending on your mandate).

Macro Hopium/Doomium


VIX

Let's start with volatility, or more specifically, the VIX index. It briefly spiked above 13 on Wednesday as global bond selling, concerns about the next Fed Chairperson and even some pre-earnings anxiety swept through the market. It finished the week at 9.8 which was lower than where it closed the prior Friday. VXN, a measure of the Nasdaq volatility, also dropped significantly as the Nasdaq composite surged more than 2%.

We do believe that the biggest risk facing the market is a spike in correlation and volatility – but I don't see that risk as very high right now. We have VIX showing up as barely in the green – meaning it might be a buy, but it isn't that compelling.

Reasons VIX can stay low
Seasonality. With fewer trading days as we start the U.S. holiday season can often push VIX lower. There have been instances, like the fiscal cliff and around elections, that hasn't been the case, but anyone looking to buy VIX must take seasonality into account.
Expectations for Tax Reform in 2017 are low. Anything short of killing all possibility of tax reform is likely to be largely ignored by the market. The market does expect Tax Reform, but not until early next year. So long as it looks like it is grinding towards that conclusion, there is little need for markets to react – keeping VIX low. Any setback that can be framed as 'negotiations' will be muted. We are not sure what will constitute derailment, but we suspect we will know it if we see it.

Surprisingly Nervous Volatility Sellers
No Rush to Sell VIX. When VIX dropped into the close on Wednesday I expect to see large inflows into the short VIX ETFs and ETNs. When VIX spiked in August, we saw extremely large inflows into those stocks. We didn't see anything like this, which is an indicator that the sellers of volatility are more cautious here, which as a contrarian, means there is less likelihood of a VIX spike.

SVXY Shares Outstanding Aug vs Oct


We did see a significant reduction in shares outstanding in UVXY – an ETF that is double long the VIX short term futures index. It looks like either profit taking, or more accurately, investors happy to get out with less of a loss than they had, but nothing so dramatic to indicate volatility bulls (market bears) have given up yet.

From a technical standpoint, the VIX futures curve is relatively flat. The 3rd VIX futures contract (January) closed at 13.35 versus the 1st VIX futures contract (November) which closed at 11.45. That spread of 1.9 is almost exactly the average for the year between the 3rd and 1st VIX futures contract (UX3 vs UX1 are the tickers on Bloomberg).
Geopolitical Tail Risk
VIX has responded most violently to increased geopolitical risk. More than any other asset class, VIX has responded when geopolitical risk has increased. Academy Securities hosted a client conference call on October 18th (replays are available) where Major General (retired) Spider Marks analyzed the White House Chief of Staff's assertion that the North Korea threat is 'manageable' and largely agreed with that assessment. We will update you as our views on current geopolitical risk evolve, but in the meantime, for those concerned about it, the best hedges are either VIX call options of long dated European Sovereign Debt – which leads us to our next asset classes.
Bunds and Treasuries

As of the initial writing of this report, we do not know who President Trump will name as next Fed Chairperson, but like everyone else, we await that decision as it should provide some clarity. We view that while there will be an initial price reaction to any decision, the market will quickly rule out the possibility of a major change in policy. The reality is that the head of the Fed is virtually forced to be dovish. If they are dovish and the economy does well – they are lauded. If they are dovish and the economy does poorly – they can just get even more dovish. The only thing that really hurts them, is being hawkish and the economy slowing. Why risk that? Draghi didn't risk that this week!

We continue to view Treasuries as a good candidate to be underweight as my ongoing target for the 10-year treasury is 2.60% with a chance of briefly spiking above that. The fundamentals for treasury investors are poor – improving economic data, D.C. trudging its way towards a near term deficit increasing tax plan, etc. There seems to be more denial in the bond market than the equity market on the potential for sustained economic growth. 

We struggle with the positioning of the bond market as many surveys indicate extreme bearish positioning, yet we find relatively few bears and a disproportionate number of bulls – who are bulls because everyone else is bearish – despite my inability to find that overwhelming bearish community.

Draghi does it again – crafting every action to be as dovish as possible.

German 10 Year Bund Yields


Bunds bounced right at the 0.49% yield level again. That is the 4th time this year that bunds have failed to rally though that level.

While it is hard to like European yields here, they are universally hated. That puts them into the 'yellow' or neutral area – at least until some more of the short positions are closed post Draghi.

It is difficult to disentangle emotions from true market impact regarding what is occurring in Spain and Catalonia. The headlines and images are awful, but it is difficult to form a direct and near-term path that impact all European markets, let alone global markets. It needs to be watched and while the market's muted reaction may 'feel' wrong, it seems correct from a trading viewpoint.

Bunds (and other high credit quality EU Sovereign Debt) can provide excellent protection from North Korean Geopolitical risk. Any risk-off trading emanating from Korea should help sovereign debt yields, but should also strengthen the Euro versus the Yen and versus the Dollar – adding an extra kicker to those bonds.
Dollar Weakness

DXY, a dollar index has rebounded sharply since threatening to break through multi-year lows in early September. While there is nothing that changes my view that this administration wants a weaker dollar and is capable of jawboning it down, the clear diversion between a Fed that seems intent on hiking and an ECB that figured out how to renew its dovish bias, could support the dollar. 

DXY Bounce on Support & Retakes Moving Averages


DXY broke the 100-day moving average last week as it closed at 94.9. That puts the 200-day moving average of 96.9 as a possible target. The model is biased towards weaker dollar, but with very limited conviction.
Domestic Stocks

After last week's surge, both U.S. Large Cap and U.S. Small Cap stocks looked stretched. Sentiment is clearly high for both groups by virtually any measure, but the fundamentals seem to warrant the valuations here. If something occurs to really disrupt the Tax Reform than look for significant pullbacks as that would dramatically shift the fundamental outlook.
Credit

Boring. Not sure that we can put a better description than boring on the overall credit market. Individual companies and sectors are exhibiting some idiosyncratic risk, but overall, risks and rewards seem balanced. Credit spreads are tight, but with the global economy marching along and volatility suppressed – there is little need for credit spreads to widen. In fact, while equities are hitting all-time highs, credit spreads are still above their pre-crisis lows.

Tax Reform can create some winners and losers – especially once Washington decides what to do, if anything, about the deductibility of interest expenses. 

We will run a full Fixed Income Hopium/Doomium Report next where we will delve deeper into the fixed income markets while drilling down into high yield, investment grade, bonds versus loans, structured credit, etc.
Oil

For much of the year, we had a range on oil of $40 to $55, but we think we could support higher oil prices here. Sentiment does seem bullish, but may be behind the bullish case. We have a bias towards domestic energy companies – equities and high yield bonds – as there is still an undercurrent in Washington that wants to focus on energy selfsufficiency. Tax Reform and Decreased Regulations should help these companies, especially if it releases any pent-up demand for M&A activity (high yield bonds tend to do better than IG bonds during periods of M&A and the high yield energy bonds could do very well if we get that combination of higher prices and reduced regulation.


Bottom Line

Relatively few obvious trades out there, at least as generated by this model. We really want to see outliers and as much as we stare at this, it is currently difficult to identify outliers.

Short treasuries and short USD might be an interesting pair.

Long oil versus short gold would need some additional work, but is another possibility.

Own some VIX calls – it hasn't worked, and we would wait to see sentiment get a bit more extreme on the 'volatility is dead' side of things before entering.

Short equities, progressively. As CenBan is losing grip on POMO or losing it on Bond Market (tertium non datur).

As mentioned earlier, we will do full update on the fixed income and credit side of things next and will add some additional Macro Asset classes in the coming weeks.
"Daggers Are Falling From The Sky" - China Stocks, Bonds Tumble After National Congress Ends


Who could have seen this coming? (somebody suspected, anyway!!! ha ha ha)


After weeks of 'calm' - demanded by The People's Party - and well-managed 'National Team' ramps top 'prove' how much Xi's plan for the nesxt five years is being received, the end of China's National Congress has been met with... a plunge in stock and bond markets.


This is the biggest drop in the Chinese market in 11 weeks...


But it's not just stocks. The Chinese bond market is getting slammed...

China 10Y yield is up 6 days in a row (the biggest surge in rates since May) to their highest since Oct 2014...


With the Chinese yield curve now inverted for 10 straight days - the longest period of inversion ever...


As Bloomberg reports, the situation that's existed for most of 2017 - sovereign yields rising, and corporate debt remaining relatively resilient - is at risk of cracking. As appetite for bonds of any kind dwindles and authorities roll out measures that target higher-risk investments, company securities are in the line of fire.

Trending Articles

The Petrodollar's Biggest Challengers

Established in the early 1970s, the petrodollar has secured the United States' influence over the oil trade for over…

Now that the Communist Party Congress is over, China's bond holders may be about to get hit by "daggers falling from the sky," said Huachuang Securities Co., referring to aggressive deleveraging policies.

"It's very likely we will see a significant increase in corporate yields in the coming year," said David Qu, a market economist at Australia & New Zealand Banking Group Ltd. in Shanghai.

"The trigger could be tougher regulations or a default. A majority of non-bank financial institutions' debt holdings are corporate bonds, so their selloff can lead to severe consequences. Banks are underestimating authorities' intentions to tighten regulations."

"The deleveraging campaign hasn't even gone half way, and the risk of banks redeeming entrusted funds could surface at the end of this year," said Qin Han, chief bond analyst at Guotai Junan Securities Co. in Shanghai.

"The chance of a selloff in corporate bonds is increasing, which will result in a widening of their yield premium over sovereign notes."

But this is far from over, as we noted earlier, the end of China's National Congress is also ushering in the end of 'coordinated global growth'...

As Citi writes, "China's Party Congress has concluded and Xi Jinping's position as President has been consolidated. Given there are no standing committee members in their 50s, it suggests there are no apparent heirs for Mr. Xi, opening the door for him to stay on beyond 2022. One of the key questions in the run up to the congress was that once power was consolidated, would China accelerate its economic reforms. We think this is unlikely but do expect a moderation of growth, with data momentum perhaps set to continue to slow at its current pace. Note how China's MCI tends to lead Citi's macro data index for China and our MCI is still tightening."


It gets worse.

As Capital Economics writes in its China Activity Monitor note this week, the firm's China Activity Proxy (CAP) suggests that growth in China slowed last month to the weakest pace in a year and with property sales cooling and officials continuing their efforts to rein in financial risks, Cap Econ thinks that looking ahead "the economy will slow further over the coming quarters."


CapEco's ominous conclusion:

Looking ahead, we think growth will continue to slow over the coming quarters. The current props to growth appear shaky. With investment contracting in real terms, industrial output will probably soften over the months ahead. Property sales also look set to weaken further as the government's purchase curbs continue to expand. This will weigh on construction before long. More generally, with tighter monetary conditions weighing on credit growth, activity looks set to weaken further.

That the past 18 months of coordinated global growth will end in China, is quite symmetric: back in January 2016, as global markets were tumbling, aborting the Fed's plans to hike rates 4 times in 2016 and resulting in sharp economic slowdowns around the globe, it was the (still mysterious) Shanghai Accord that "saved" the world, and unleashed a burst of unprecedented, and coordinated, growth...which only cost China some $8 trillion in debt.

It will only make sense that another major Chinese event will mark the top of this economic mini cycle, and lead to the next global downturn, not to mention spike in market volatility.

domenica 29 ottobre 2017

In The Markets... "It's All About The Magic".


It's all about the magic.

Firstly, following up on the Liquidity Wave: Mario Draghi followed through on his primary mission and did not upset markets. Indeed Super Mario gave the $DAX virtually all of its price gains for October:

Magic.

Just so we're still clear who's running the price discovery show in global markets:

Central bank balance sheets have expanded by $4.5 Trillion since the beginning of 2016. pic.twitter.com/wh4mBVl99D

— Sven Henrich (@NorthmanTrader) October 27, 2017

Magic.

You do realize that Mario Draghi's term is ending in 2019. Which means he will have never raised rates once during his entire tenure. He came, he saw, and he was easy. And stayed easy. And then went on to cushy speaking engagements. Magic.

Next in the line of magic: Tech.

Tech flew to new highs on Friday on the heels of earnings reports and markets celebrated Jeff Bezos becoming the richest man in the world with a $90B net worth.

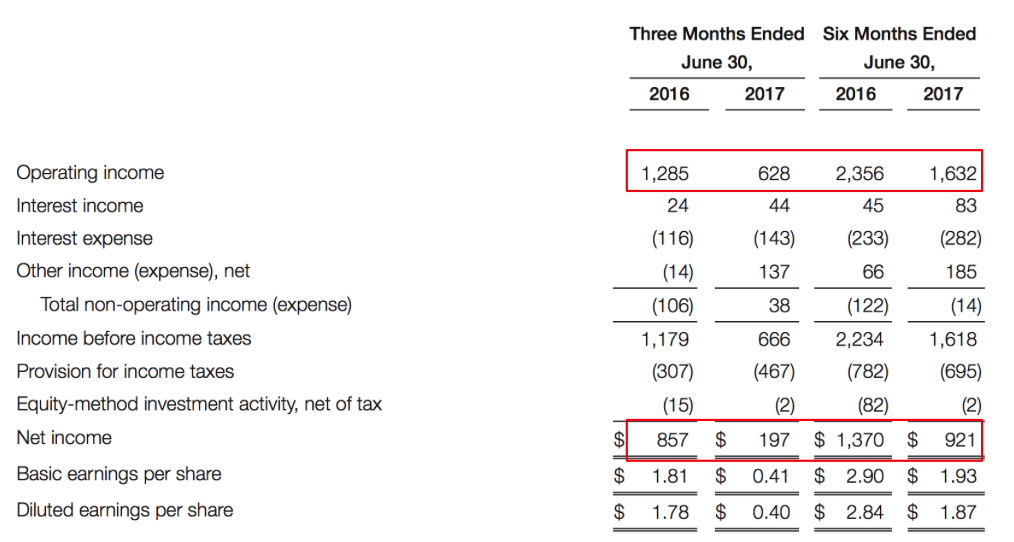
Magic. Cause it was all done with a shrinking earnings picture:

Operating income cut in half and net income 23% of what it was last year. But hey, disruption and destruction of the entire retail space as we've seen 6,700 store closings already in 2017.

So one company kills the margins for everyone else, has an operating margin of virtually zero itself, but hey, magic:

Indeed the real magic is in market cap expansion. It is true the tech monopolies are killing it in terms of growth and market share, but the market cap expansion that comes with it is awe inspiring.

Someone ran the math:

AMZN, GOOG, MSFT, INTC
Value today: $2096b
Value 1y ago: $1592b
Increase in value: $504b or 31.7%
Increase in earnings: $2.2b https://t.co/bH1J8bCKKC

— Anil (@anilvohra69) October 29, 2017

AMZN now has a market cap of $528B with a PEG ratio of 4.77. But it's not about valuation and it's clearly not about earnings. It's about magic.

So tech screamed to new highs on Friday.

Watch the magic:

New Highs vs New Lows on Nasdaq:

$NDX stock above their 50MA:

I take it you noticed that sinking feeling.

But it's not only tech, it extends to the entire market:

$SPX:

$NYA:

Indeed the new highs on Friday?

Came on a negative $NYMO:

The entire new highs picture since September has come on lower and lower $NYMO readings.

Check recent cumulative advance/decline:

New highs on running cumulative negative advance/decline issues.

And all of this of course is reflective of a long standing trend in equal weight that just fell off the cliff:

But hey. Time for tax cuts, the top 1% are suffering:

Tax cuts now!https://t.co/yY6q7TD9wT

— Sven Henrich (@NorthmanTrader) October 27, 2017

Convincing voters that these folks need tax cuts so that they themselves may fare better may indeed be a true magic act.

But that's what everyone is waiting for I'm presuming. After all this would be the reason why investors are fully long positioned per the Rydex bull/bear ratio, now at 0.05:

With valuations in the 99th percentile of history:

And planning to add more and more and more:

Yes, everybody loves magic. Just remember magic levitation may simply be a cheap trick with someone pulling on a string:

SPOTTED: Magic levitation may not be so magic. pic.twitter.com/XSKzo1XjgX

— Sven Henrich (@NorthmanTrader) October 29, 2017

Next week we will get to see another magic show: The FOMC will tell us why they can't raise rates again and we will find out who Janet Yellen's replacement will be.

I'm sure it will be magical.

CHINA'S MINSKY MOMENT

Sometimes you have to love the naivety of the markets. At this week's Communist Party Congress meeting in Beijing, the governor of the PBoC (People's Bank of China) said the following;

"If we are too optimistic when things go smoothly, tensions build up, which could lead to a sharp correction, what we call a 'Minsky moment'. That's what we should particularly defend against."

Yet instead of focusing on this dire warning, markets are busy trying to discount the chance of a Powell Fed or a Republican tax cut. Although both of these developments would be important, China is the tail that wags the dog. Full stop. Figure out China, and all the other financial market forecasts become that much easier.


Aren't Central Bank warnings cheap?

Some might argue this "Minsky moment" warning is nothing more than a Central Bank whistling in the wind. Didn't Greenspan caution about a similar concern with his "irrational exuberance" speech? And didn't that end up being a complete non-event?

Yet I would argue that China is not the same as other countries. Although there are market elements to their economy, to a large degree, China is still a command economy. If Chinese leadership wants a particular outcome, they can just demand it, and it will happen.

So when the head of the PBoC warns about a "Minsky moment", it's probably not a good idea to load up on financial assets. For the longest time, China exported goods and imported developed nation debt and other financial assets. They had already started down the road of re-balancing their economy away from this export driven model, but this recent development confirms that the old playbook should be thrown out the window. The global financial system is changing, and China is leading the way. Their moves will reverberate for years in the future. The Chinese authorities have just put up the warning flag, and you would be foolish to not believe it.


Chinese short term market support is ending

This long term warning coincides with my belief that over the short term, the risks are all to the downside. I have been banging the drum on the fact that the Chinese government have done everything in their power to keep markets stabilized through their Communist Party Congress.

They haven't even hidden this fact. From the big sign above the Shenzhen Securities Exchange building that read "Use every effort to protect the stability of stock market for 20 days," to the recent release that the Chinese government has asked firms to delay bad result during Congress, the message is clear.

Every effort has been made to keep financial markets bid until after the Communist Party Congress. And guess what?  It ended 25th oct. morning. Yup - that's it. All done. Pink tickets are once again allowed.


It adds up to a great short entry

So let's review. Longer term, the Chinese are telling you to be wary about a "Minsky moment." Shorter term, they have been actively engaged in keeping the markets propped up, but that support is ending.

Meanwhile, according to the terrific Nordea analyst Martin Enlund, hedge funds are falling all over themselves bullish:

It's tough because it has been a one way bet for so long, but from a trading perspective, this offers a great risk reward for a dark side stab.

Don't say no one warned you, the PBoC Chairman laid it out for us in black and white.

Visualizing $63 Trillion Of World Debt


If you add up all the money that national governments have borrowed, it tallies to a hefty $63 trillion.


Courtesy of: Visual Capitalist

In an ideal situation, governments are just borrowing this money to cover short-term budget deficits or to finance mission critical projects. However, as Visual Capitalist's Jeff Desjardins notes, around the globe, countries have taken to the idea of running constant deficits as the normal course of business, and too much accumulation of debt is not healthy for countries or the global economy as a whole.

The U.S. is a prime example of "debt creep" – the country hasn't posted an annual budget surplus since 2001, when the federal debt was only $6.9 trillion (54% of GDP). Fast forward to today, and the debt has ballooned to roughly $20 trillion (107% of GDP), which is equal to 31.8% of the world's sovereign debt nominally.
THE WORLD DEBT LEADERBOARD

In today's infographic, we look at two major measures: (1) Share of global debt as a percentage, and (2) Debt-to-GDP.

Let's look at the top five "leaders" in each category, starting with share of global debt on a nominal basis:


Together, just these five countries together hold 66% of the world's debt in nominal terms – good for a total of $41.6 trillion.

Next, here's the top five for Debt-to-GDP:


While only Italy and Japan here are considered major economies on a global scale, the high debt levels of countries like Greece or Portugal are also important to monitor.


In the IMF's baseline scenario, Greece's government debt will reach 275% of its GDP by 2060, when its financing needs will represent 62% of GDP.

- A recent IMF report, obtained by Bloomberg

Greece, for example, is continuing along a particularly unsustainable path – and external creditors are getting stingier. Most recently, both the IMF and Greece's euro-area creditors have demanded for the country to implement a law that automatically introduces austerity measures if a budget surplus of 3.5% of GDP isn't hit.

While Greece has dismissed such demands as "unacceptable", the country – along with many others around the globe – will have to accept that constant debt accumulation has eventual consequences.

Fwd: 2000 y econ hist

Why trying to bet against this madness is a widow-maker trade. Logic has nothing to do with it.

Investors who've approached this stock market and its ludicrous valuations over the past few years from a point of view of fundamentals and "value" – thus, often on the side of short-selling those stocks – have gotten clobbered, or were at least left in the dust by buy-buy-buy fundamentals-don't-matter automatons.

This has become an exercise in frustration-management for many – including, apparently, David Einhorn, founder and president of Greenlight Capital, a $7 billion hedge fund that became successful by searching for overvalued and undervalued companies and betting one way or the other. This strategy has hit the rocks in recent years. So far this year, the fund is up 3.3% while the S&P 500 is up 14%.

In a letter to Greenlight's clients he unloaded his frustrations about this crazy market.

"The market remains very challenging for value investing strategies, as growth stocks have continued to outperform value stocks. The persistence of this dynamic leads to questions regarding whether value investing is a viable strategy.

"The knee-jerk instinct is to respond that when a proven strategy is so exceedingly out of favor that its viability is questioned, the cycle must be about to turn around. Unfortunately, we lack such clarity. After years of running into the wind, we are left with no sense stronger than, 'it will turn when it turns.'"

On the short side, he cited Amazon, Tesla, and Netflix, whose ludicrous valuations are glaring examples of what a good short-target looks like, but so far, most of those daring souls who tried to follow logic and profit from shorting these stocks over the past few years have gotten their head handed to them.

Here's what Einhorn said about the three heroes that he considers "our three most well-known 'bubble' shorts":

Amazon: "Our view is that just because Amazon can disrupt somebody else's profit stream, it doesn't mean that Amazon earns that profit stream. For the moment, the market doesn't agree. Perhaps, simply being disruptive is enough."

Tesla: "Tesla had an awful quarter both in its current results and future prospects. In response, its shares fell almost 6%. We believe it deserved much worse."

Netflix: "On the second quarter conference call, the CEO stated, 'In some senses the negative free cash flow will be an indicator of enormous success.' To us, all it indicates is that Netflix is capable of dramatically changing the economics of stand-up comedy in favor of the comedians."

Yet Amazon is up 30% this year, Tesla and Netflix 58%! This market simply doesn't tolerate logic other than buy, buy, buy – until something changes.

"Given the performance of certain stocks, we wonder if the market has adopted an alternative paradigm for calculating equity value. What if equity value has nothing to do with current or future profits and instead is derived from a company's ability to be disruptive, to provide social change, or to advance new beneficial technologies, even when doing so results in current and future economic loss?

"It's clear that a number of companies provide products and services to customers that come with a subsidy from equity holders. And yet, on a mark-to-market basis, the equity holders are doing just fine."

This "subsidy" from equity holders and creditors to customers has become a common theme. How long are stockholders and bondholders willing to subsidize the prices that consumers pay for goods and services? Netflix thinks forever. Rational brains think not. But so far, rational brains have lost nearly every time.

These companies fight for market share with bleeding-edge pricing to "disrupt," but equity holders and creditors, instead of punishing companies for it, fall all over them and bid up their shares and bonds, and thus encourage them to do this.

The most glaring example is Tesla, a tiny automaker that's now bleeding billions of dollars a year in cash and whose vehicle production is so minuscule it's not even a rounding error in total global production of 94.6 million vehicles. And yet, it has a market capitalization of $56 billion. This disconnect is inexplicable for rational minds – and makes Tesla a very juicy target for shorting the shares.

But shorting crazy stocks in a crazy market is a widow-maker trade; once shares have reached crazy heights, there is no longer a rational limit, by definition, to how much crazier the already crazy shares can get. Someday, those bets will be correct. But in the prevailing market insanity, it's impossible to divine when exactly that will be.

It's interesting that Einhorn, after these years of punishment, is now contemplating the existence of an "alternative paradigm" to explain the craziness. And I find his doubts enlightening. As he pointed out himself, the very existence of these doubts and his consideration of an "alternative paradigm" give me the feeling – and that's all it is – that the turning point in this madness, wherever it is, is now just a little closer.

Netflix, rated four notches into junk, just sold $1.6 billion in junk bonds at a yield of only 4.875%. It was its largest bond sale in a series of ever larger bond sales in a bond market that lives in a fantasy world.

Why the next stock market crash will be faster and bigger than ever before

US stock markets hit another all-time high on Friday.
The S&P 500 is nearing 2,600 and the Dow is over 23,300.

In fact, US stocks have only been more expensive two times since 1881. 

According to Yale economist Robert Shiller's Cyclically Adjusted Price to Earnings (CAPE) ratio – which is the market price divided by ten years' average earnings – the S&P 500 is above 31. The last two times the market reached such a high valuation were just before the Great Depression in 1929 and the tech bubble in 1999-2000.
Some of the blame for high valuation goes to the so-called "FANG" stocks (Facebook, Amazon, Netflix and Google), whose average P/E is now around 130.
But there's something different about today's bull market…
Simply put, everything is going up at once.
Leading up to the tech bubble bursting, investors would dump defensive stocks (thereby pushing down their valuations) to buy high-flying tech stocks like Intel and Cisco – the result was a valuation dispersion.
The S&P cap-weighted index (which was influenced by the high valuations of the S&P's most expensive tech stocks) traded at 30.6 times earnings. The equal-weighted S&P index (which, as the name implies, weights each constituent stock equally, regardless of size) traded at 20.7 times.
Today, despite sky-high FANG valuations, the S&P market-cap weighted and equal-weighted indexes both trade at around 22 times earnings.
Thanks to the trillions of dollars printed by the Federal Reserve (and the popularity of passive investing, which we'll discuss in a moment), investors are buying everything.
In a recent report, investment bank Morgan Stanley wrote:
We say this not as hyperbole, but based on a quantitative perspective… Dispersions in valuations and growth rates are among the lowest in the last 40 years; stocks are at their most idiosyncratic since 2001.
So, ask yourself… With stocks trading at some of the highest levels in history, is now the time to be adding more equity risk?
Or, as billionaire hedge fund manager Seth Klarman notes… "When securities prices are high, as they are today, the perception of risk is muted, but the risks to investors are quite elevated."
Volatility – as measured by the Volatility Index (VIX) – remains below 10 (close to its lowest levels in history). For comparison, the VIX hit 89.53 in October 2008, as the market plunged.
We haven't seen a 3% down day since the election. And if that holds through the end of the year, it will be the longest streak in history.
And this false sense of security comes just as the main driver of this bull market – the trillions of dollars global central banks printed after the GFC – is coming to an end.
Markets saw around $500 billion of accommodation in 2016. And "quantitative tightening" should suck about $1 trillion out of the markets in 2018… That's a $1.5 trillion swing in two years. And it's a major headwind for today's already overvalued markets.
But that's just one issue. Remember, we also have…
Slowing global growth, record-high debt, potential nuclear war with North Korea, a rising world power in China, and cyber terrorism (just to name a few of the potential pitfalls) …
Still, investors continue to put money to work without a care in the world.
And more and more of that money is being invested with ZERO consideration of market valuation – thanks to the rise of passive investing.
Through July 2017, exchange-traded funds (ETFs) took in a record $391 billion – surpassing 2016's record inflow of $390 billion.
According to Bank of America, 37% of the S&P 500 stocks are now managed passively.
Investors in these passive index funds and ETFs pay super-low fees in return for an automated investment process. For example, any money invested in a passively-managed S&P 500 ETF is equally distributed (based on market cap weighting) across the 500 S&P companies… So, companies like Apple, Google, Facebook and Amazon get the biggest share of that money.
The result… as this dumb money rushes in, the biggest stocks get even bigger – despite their already ludicrous valuations.
And the biggest players in this field are amassing a tremendous amount of power.
Vanguard, which introduced the world's first passive index fund for individuals in 1976, has $4.7 trillion in assets (around $3 trillion of that is passive).
BlackRock, the world's largest asset manager and owner of the iShares ETF franchise, is approaching $6 trillion in assets. And only 28% of BlackRock's assets are actively managed.
Passive funds owned by these two firms are taking in $3.5 billion a day.
Bank of America estimates Vanguard owns 6.8% of the S&P 500 (and stakes of more than 10% in over 80 S&P 500 stocks).
And as long as the money keeps flowing into passive funds, the bubble keeps expanding.
At a time of exceptional market risk, more and more money is being managed without any notion of risk.
But what happens when these uninformed and value-agnostic investors have to sell?
Humans are emotional creatures. And when we do finally see that 3% (or even larger) down day, investors will rush for the exits.
And the computers will pile on the selling (every model based on historically low volatility will completely break when volatility spikes).
But when the wave of selling comes, who will be there to buy?
As these passive funds dump the largest stocks in the world, we'll see an air pocket… nobody will be there to hit the bid.
And when the drop comes, it will come faster than anyone expects.
So, while most investors are ignoring risk, I'd advise you to use this record-high stock market to your advantage…
Sell some expensive stocks to raise cash. Own some gold. And allocate capital to sectors of the market that haven't been blown out of proportion thanks to the popularity of passive investing. That means looking at smaller stocks and stocks outside the US.

Even if stocks go up for another year, which they may, it's simply not worth the risk to chase them higher… Because the downturn will be devastating.


Fabrizio