MARKET FLASH:

"It seems the donkey is laughing, but he instead is braying (l'asino sembra ridere ma in realtà raglia)": si veda sotto "1927-1933: Pompous Prognosticators" per avere la conferma che la storia non si ripete ma fà la rima.


domenica 29 ottobre 2017

In The Markets... "It's All About The Magic".


It's all about the magic.

Firstly, following up on the Liquidity Wave: Mario Draghi followed through on his primary mission and did not upset markets. Indeed Super Mario gave the $DAX virtually all of its price gains for October:

Magic.

Just so we're still clear who's running the price discovery show in global markets:

Central bank balance sheets have expanded by $4.5 Trillion since the beginning of 2016. pic.twitter.com/wh4mBVl99D

— Sven Henrich (@NorthmanTrader) October 27, 2017

Magic.

You do realize that Mario Draghi's term is ending in 2019. Which means he will have never raised rates once during his entire tenure. He came, he saw, and he was easy. And stayed easy. And then went on to cushy speaking engagements. Magic.

Next in the line of magic: Tech.

Tech flew to new highs on Friday on the heels of earnings reports and markets celebrated Jeff Bezos becoming the richest man in the world with a $90B net worth.

Magic. Cause it was all done with a shrinking earnings picture:
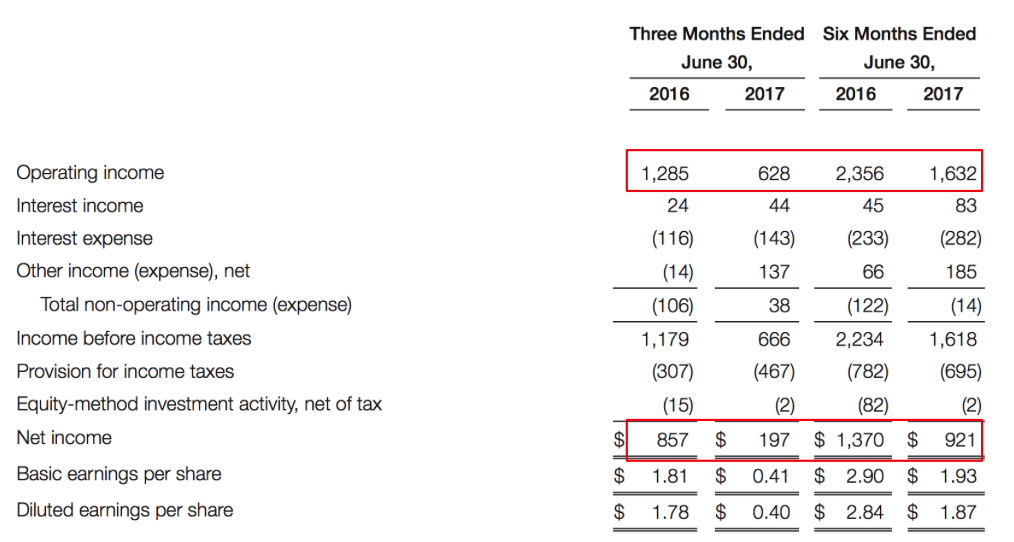
Operating income cut in half and net income 23% of what it was last year. But hey, disruption and destruction of the entire retail space as we've seen 6,700 store closings already in 2017.

So one company kills the margins for everyone else, has an operating margin of virtually zero itself, but hey, magic:

Indeed the real magic is in market cap expansion. It is true the tech monopolies are killing it in terms of growth and market share, but the market cap expansion that comes with it is awe inspiring.

Someone ran the math:

AMZN, GOOG, MSFT, INTC
Value today: $2096b
Value 1y ago: $1592b
Increase in value: $504b or 31.7%
Increase in earnings: $2.2b https://t.co/bH1J8bCKKC

— Anil (@anilvohra69) October 29, 2017

AMZN now has a market cap of $528B with a PEG ratio of 4.77. But it's not about valuation and it's clearly not about earnings. It's about magic.

So tech screamed to new highs on Friday.

Watch the magic:

New Highs vs New Lows on Nasdaq:

$NDX stock above their 50MA:

I take it you noticed that sinking feeling.

But it's not only tech, it extends to the entire market:

$SPX:

$NYA:

Indeed the new highs on Friday?

Came on a negative $NYMO:

The entire new highs picture since September has come on lower and lower $NYMO readings.

Check recent cumulative advance/decline:

New highs on running cumulative negative advance/decline issues.

And all of this of course is reflective of a long standing trend in equal weight that just fell off the cliff:

But hey. Time for tax cuts, the top 1% are suffering:

Tax cuts now!https://t.co/yY6q7TD9wT

— Sven Henrich (@NorthmanTrader) October 27, 2017

Convincing voters that these folks need tax cuts so that they themselves may fare better may indeed be a true magic act.

But that's what everyone is waiting for I'm presuming. After all this would be the reason why investors are fully long positioned per the Rydex bull/bear ratio, now at 0.05:

With valuations in the 99th percentile of history:

And planning to add more and more and more:

Yes, everybody loves magic. Just remember magic levitation may simply be a cheap trick with someone pulling on a string:

SPOTTED: Magic levitation may not be so magic. pic.twitter.com/XSKzo1XjgX

— Sven Henrich (@NorthmanTrader) October 29, 2017

Next week we will get to see another magic show: The FOMC will tell us why they can't raise rates again and we will find out who Janet Yellen's replacement will be.

I'm sure it will be magical.

CHINA'S MINSKY MOMENT

Sometimes you have to love the naivety of the markets. At this week's Communist Party Congress meeting in Beijing, the governor of the PBoC (People's Bank of China) said the following;

"If we are too optimistic when things go smoothly, tensions build up, which could lead to a sharp correction, what we call a 'Minsky moment'. That's what we should particularly defend against."

Yet instead of focusing on this dire warning, markets are busy trying to discount the chance of a Powell Fed or a Republican tax cut. Although both of these developments would be important, China is the tail that wags the dog. Full stop. Figure out China, and all the other financial market forecasts become that much easier.


Aren't Central Bank warnings cheap?

Some might argue this "Minsky moment" warning is nothing more than a Central Bank whistling in the wind. Didn't Greenspan caution about a similar concern with his "irrational exuberance" speech? And didn't that end up being a complete non-event?

Yet I would argue that China is not the same as other countries. Although there are market elements to their economy, to a large degree, China is still a command economy. If Chinese leadership wants a particular outcome, they can just demand it, and it will happen.

So when the head of the PBoC warns about a "Minsky moment", it's probably not a good idea to load up on financial assets. For the longest time, China exported goods and imported developed nation debt and other financial assets. They had already started down the road of re-balancing their economy away from this export driven model, but this recent development confirms that the old playbook should be thrown out the window. The global financial system is changing, and China is leading the way. Their moves will reverberate for years in the future. The Chinese authorities have just put up the warning flag, and you would be foolish to not believe it.


Chinese short term market support is ending

This long term warning coincides with my belief that over the short term, the risks are all to the downside. I have been banging the drum on the fact that the Chinese government have done everything in their power to keep markets stabilized through their Communist Party Congress.

They haven't even hidden this fact. From the big sign above the Shenzhen Securities Exchange building that read "Use every effort to protect the stability of stock market for 20 days," to the recent release that the Chinese government has asked firms to delay bad result during Congress, the message is clear.

Every effort has been made to keep financial markets bid until after the Communist Party Congress. And guess what?  It ended 25th oct. morning. Yup - that's it. All done. Pink tickets are once again allowed.


It adds up to a great short entry

So let's review. Longer term, the Chinese are telling you to be wary about a "Minsky moment." Shorter term, they have been actively engaged in keeping the markets propped up, but that support is ending.

Meanwhile, according to the terrific Nordea analyst Martin Enlund, hedge funds are falling all over themselves bullish:

It's tough because it has been a one way bet for so long, but from a trading perspective, this offers a great risk reward for a dark side stab.

Don't say no one warned you, the PBoC Chairman laid it out for us in black and white.

Visualizing $63 Trillion Of World Debt


If you add up all the money that national governments have borrowed, it tallies to a hefty $63 trillion.


Courtesy of: Visual Capitalist

In an ideal situation, governments are just borrowing this money to cover short-term budget deficits or to finance mission critical projects. However, as Visual Capitalist's Jeff Desjardins notes, around the globe, countries have taken to the idea of running constant deficits as the normal course of business, and too much accumulation of debt is not healthy for countries or the global economy as a whole.

The U.S. is a prime example of "debt creep" – the country hasn't posted an annual budget surplus since 2001, when the federal debt was only $6.9 trillion (54% of GDP). Fast forward to today, and the debt has ballooned to roughly $20 trillion (107% of GDP), which is equal to 31.8% of the world's sovereign debt nominally.
THE WORLD DEBT LEADERBOARD

In today's infographic, we look at two major measures: (1) Share of global debt as a percentage, and (2) Debt-to-GDP.

Let's look at the top five "leaders" in each category, starting with share of global debt on a nominal basis:


Together, just these five countries together hold 66% of the world's debt in nominal terms – good for a total of $41.6 trillion.

Next, here's the top five for Debt-to-GDP:


While only Italy and Japan here are considered major economies on a global scale, the high debt levels of countries like Greece or Portugal are also important to monitor.


In the IMF's baseline scenario, Greece's government debt will reach 275% of its GDP by 2060, when its financing needs will represent 62% of GDP.

- A recent IMF report, obtained by Bloomberg

Greece, for example, is continuing along a particularly unsustainable path – and external creditors are getting stingier. Most recently, both the IMF and Greece's euro-area creditors have demanded for the country to implement a law that automatically introduces austerity measures if a budget surplus of 3.5% of GDP isn't hit.

While Greece has dismissed such demands as "unacceptable", the country – along with many others around the globe – will have to accept that constant debt accumulation has eventual consequences.

Fwd: 2000 y econ hist

Why trying to bet against this madness is a widow-maker trade. Logic has nothing to do with it.

Investors who've approached this stock market and its ludicrous valuations over the past few years from a point of view of fundamentals and "value" – thus, often on the side of short-selling those stocks – have gotten clobbered, or were at least left in the dust by buy-buy-buy fundamentals-don't-matter automatons.

This has become an exercise in frustration-management for many – including, apparently, David Einhorn, founder and president of Greenlight Capital, a $7 billion hedge fund that became successful by searching for overvalued and undervalued companies and betting one way or the other. This strategy has hit the rocks in recent years. So far this year, the fund is up 3.3% while the S&P 500 is up 14%.

In a letter to Greenlight's clients he unloaded his frustrations about this crazy market.

"The market remains very challenging for value investing strategies, as growth stocks have continued to outperform value stocks. The persistence of this dynamic leads to questions regarding whether value investing is a viable strategy.

"The knee-jerk instinct is to respond that when a proven strategy is so exceedingly out of favor that its viability is questioned, the cycle must be about to turn around. Unfortunately, we lack such clarity. After years of running into the wind, we are left with no sense stronger than, 'it will turn when it turns.'"

On the short side, he cited Amazon, Tesla, and Netflix, whose ludicrous valuations are glaring examples of what a good short-target looks like, but so far, most of those daring souls who tried to follow logic and profit from shorting these stocks over the past few years have gotten their head handed to them.

Here's what Einhorn said about the three heroes that he considers "our three most well-known 'bubble' shorts":

Amazon: "Our view is that just because Amazon can disrupt somebody else's profit stream, it doesn't mean that Amazon earns that profit stream. For the moment, the market doesn't agree. Perhaps, simply being disruptive is enough."

Tesla: "Tesla had an awful quarter both in its current results and future prospects. In response, its shares fell almost 6%. We believe it deserved much worse."

Netflix: "On the second quarter conference call, the CEO stated, 'In some senses the negative free cash flow will be an indicator of enormous success.' To us, all it indicates is that Netflix is capable of dramatically changing the economics of stand-up comedy in favor of the comedians."

Yet Amazon is up 30% this year, Tesla and Netflix 58%! This market simply doesn't tolerate logic other than buy, buy, buy – until something changes.

"Given the performance of certain stocks, we wonder if the market has adopted an alternative paradigm for calculating equity value. What if equity value has nothing to do with current or future profits and instead is derived from a company's ability to be disruptive, to provide social change, or to advance new beneficial technologies, even when doing so results in current and future economic loss?

"It's clear that a number of companies provide products and services to customers that come with a subsidy from equity holders. And yet, on a mark-to-market basis, the equity holders are doing just fine."

This "subsidy" from equity holders and creditors to customers has become a common theme. How long are stockholders and bondholders willing to subsidize the prices that consumers pay for goods and services? Netflix thinks forever. Rational brains think not. But so far, rational brains have lost nearly every time.

These companies fight for market share with bleeding-edge pricing to "disrupt," but equity holders and creditors, instead of punishing companies for it, fall all over them and bid up their shares and bonds, and thus encourage them to do this.

The most glaring example is Tesla, a tiny automaker that's now bleeding billions of dollars a year in cash and whose vehicle production is so minuscule it's not even a rounding error in total global production of 94.6 million vehicles. And yet, it has a market capitalization of $56 billion. This disconnect is inexplicable for rational minds – and makes Tesla a very juicy target for shorting the shares.

But shorting crazy stocks in a crazy market is a widow-maker trade; once shares have reached crazy heights, there is no longer a rational limit, by definition, to how much crazier the already crazy shares can get. Someday, those bets will be correct. But in the prevailing market insanity, it's impossible to divine when exactly that will be.

It's interesting that Einhorn, after these years of punishment, is now contemplating the existence of an "alternative paradigm" to explain the craziness. And I find his doubts enlightening. As he pointed out himself, the very existence of these doubts and his consideration of an "alternative paradigm" give me the feeling – and that's all it is – that the turning point in this madness, wherever it is, is now just a little closer.

Netflix, rated four notches into junk, just sold $1.6 billion in junk bonds at a yield of only 4.875%. It was its largest bond sale in a series of ever larger bond sales in a bond market that lives in a fantasy world.

Why the next stock market crash will be faster and bigger than ever before

US stock markets hit another all-time high on Friday.
The S&P 500 is nearing 2,600 and the Dow is over 23,300.

In fact, US stocks have only been more expensive two times since 1881. 

According to Yale economist Robert Shiller's Cyclically Adjusted Price to Earnings (CAPE) ratio – which is the market price divided by ten years' average earnings – the S&P 500 is above 31. The last two times the market reached such a high valuation were just before the Great Depression in 1929 and the tech bubble in 1999-2000.
Some of the blame for high valuation goes to the so-called "FANG" stocks (Facebook, Amazon, Netflix and Google), whose average P/E is now around 130.
But there's something different about today's bull market…
Simply put, everything is going up at once.
Leading up to the tech bubble bursting, investors would dump defensive stocks (thereby pushing down their valuations) to buy high-flying tech stocks like Intel and Cisco – the result was a valuation dispersion.
The S&P cap-weighted index (which was influenced by the high valuations of the S&P's most expensive tech stocks) traded at 30.6 times earnings. The equal-weighted S&P index (which, as the name implies, weights each constituent stock equally, regardless of size) traded at 20.7 times.
Today, despite sky-high FANG valuations, the S&P market-cap weighted and equal-weighted indexes both trade at around 22 times earnings.
Thanks to the trillions of dollars printed by the Federal Reserve (and the popularity of passive investing, which we'll discuss in a moment), investors are buying everything.
In a recent report, investment bank Morgan Stanley wrote:
We say this not as hyperbole, but based on a quantitative perspective… Dispersions in valuations and growth rates are among the lowest in the last 40 years; stocks are at their most idiosyncratic since 2001.
So, ask yourself… With stocks trading at some of the highest levels in history, is now the time to be adding more equity risk?
Or, as billionaire hedge fund manager Seth Klarman notes… "When securities prices are high, as they are today, the perception of risk is muted, but the risks to investors are quite elevated."
Volatility – as measured by the Volatility Index (VIX) – remains below 10 (close to its lowest levels in history). For comparison, the VIX hit 89.53 in October 2008, as the market plunged.
We haven't seen a 3% down day since the election. And if that holds through the end of the year, it will be the longest streak in history.
And this false sense of security comes just as the main driver of this bull market – the trillions of dollars global central banks printed after the GFC – is coming to an end.
Markets saw around $500 billion of accommodation in 2016. And "quantitative tightening" should suck about $1 trillion out of the markets in 2018… That's a $1.5 trillion swing in two years. And it's a major headwind for today's already overvalued markets.
But that's just one issue. Remember, we also have…
Slowing global growth, record-high debt, potential nuclear war with North Korea, a rising world power in China, and cyber terrorism (just to name a few of the potential pitfalls) …
Still, investors continue to put money to work without a care in the world.
And more and more of that money is being invested with ZERO consideration of market valuation – thanks to the rise of passive investing.
Through July 2017, exchange-traded funds (ETFs) took in a record $391 billion – surpassing 2016's record inflow of $390 billion.
According to Bank of America, 37% of the S&P 500 stocks are now managed passively.
Investors in these passive index funds and ETFs pay super-low fees in return for an automated investment process. For example, any money invested in a passively-managed S&P 500 ETF is equally distributed (based on market cap weighting) across the 500 S&P companies… So, companies like Apple, Google, Facebook and Amazon get the biggest share of that money.
The result… as this dumb money rushes in, the biggest stocks get even bigger – despite their already ludicrous valuations.
And the biggest players in this field are amassing a tremendous amount of power.
Vanguard, which introduced the world's first passive index fund for individuals in 1976, has $4.7 trillion in assets (around $3 trillion of that is passive).
BlackRock, the world's largest asset manager and owner of the iShares ETF franchise, is approaching $6 trillion in assets. And only 28% of BlackRock's assets are actively managed.
Passive funds owned by these two firms are taking in $3.5 billion a day.
Bank of America estimates Vanguard owns 6.8% of the S&P 500 (and stakes of more than 10% in over 80 S&P 500 stocks).
And as long as the money keeps flowing into passive funds, the bubble keeps expanding.
At a time of exceptional market risk, more and more money is being managed without any notion of risk.
But what happens when these uninformed and value-agnostic investors have to sell?
Humans are emotional creatures. And when we do finally see that 3% (or even larger) down day, investors will rush for the exits.
And the computers will pile on the selling (every model based on historically low volatility will completely break when volatility spikes).
But when the wave of selling comes, who will be there to buy?
As these passive funds dump the largest stocks in the world, we'll see an air pocket… nobody will be there to hit the bid.
And when the drop comes, it will come faster than anyone expects.
So, while most investors are ignoring risk, I'd advise you to use this record-high stock market to your advantage…
Sell some expensive stocks to raise cash. Own some gold. And allocate capital to sectors of the market that haven't been blown out of proportion thanks to the popularity of passive investing. That means looking at smaller stocks and stocks outside the US.

Even if stocks go up for another year, which they may, it's simply not worth the risk to chase them higher… Because the downturn will be devastating.


Fabrizio 

sabato 28 ottobre 2017

2000 years of economic history in one chart

2,000 Years of Economic History in One Chart

Over 2,000 Years of Economic History in One Chart

All major powers compared by GDP from the year 1 AD

The Chart of the Week is a weekly Vis.Cap. feature on Fridays.
Long before the invention of modern day maps or gunpowder, the planet's major powers were already duking it out for economic and geopolitical supremacy.
Today's chart tells that story in the simplest terms possible. By showing the changing share of the global economy for each country from 1 AD until now, it compares economic productivity over a mind-boggling time period.
Originally published in a research letter by Michael Cembalest of JP Morgan, we've updated it based on the most recent data and projections from the IMF. If you like, you can still find the original chart (which goes to 2008) at The Atlantic. It's also worth noting that the original source for all the data up until 2008 is from the late Angus Maddison, a famous economic historian that published estimates on population, GDP, and other figures going back to Roman times.

A Major Caveat

If you looked at the chart in any depth, you probably noticed a big problem with it. The time periods between data points aren't equal – in fact, they are not close at all.
The first gap on the x-axis is 1,000 years and the second is 500 years. Then, as we get closer to modernity, the chart uses mostly 10 year intervals. Changing the scale like this is a big data visualization "no no", as rightly pointed out in a blog post by The Economist.
While we completely agree, we have a made an exception in this case. Why? Because getting good economic data from the early 20th century is already difficult enough – and so trying to find data in regular intervals before then seems like a fool's errand. Likewise, a stacked bar chart with different years also doesn't really do this story justice.
You can encounter similar historical data issues in Richest People of Human History graphic, and at the end of the day decided it was primarily for fun. Like today's chart, it has its share of imperfections – but ultimately, it provides a great amount of context and serves as a conversation starter.

Our Interpretation

Caveats aside, there are many stories that materialize from this simple chart. They include the colossal impact of the Industrial Revolution on the West, as well as the momentum behind the re-emergence of Asia.
But there's one other story that ties it all together: the exponential rate of human economic growth that occurred over the last century.
For thousands of years, economic progress was largely linear and linked to population growth. Without machines or technological innovations, one person could only produce so much with their time and resources.
More recently, innovations in technology and energy allowed the "hockey stick" effect to come into play. 
It happened in Western Europe and North America first, and now it's happening in other parts of the world. As this technological playing field evens, economies like China and India – traditionally some of the largest economies throughout history – are now making their big comeback. 

China's Congress Is Over, And So Is The Period Of "Coordinated Global Growth"


It is hardly a secret that thanks to nearly $4 trillion (at least) in credit creation in 2017 - more than the rest of the developed world combined - China has been the proverbial (and debt-funded) "growth" dynamo behind the recent period of "coordinated global growth." Unfortunately, much if not all of this was window dressing for the just concluded 19th Communist Party Congress, which in not so many words, made Xi Jinping into a de facto emperor with no apparent or otherwise heirs. 

The problem is that with the Congress now over, so is the period of coordinated global growth. Here's why.

As Citi writes, "China's Party Congress has concluded and Xi Jinping's position as President has been consolidated. Given there are no standing committee members in their 50s, it suggests there are no apparent heirs for Mr. Xi, opening the door for him to stay on beyond 2022. One of the key questions in the run up to the congress was that once power was consolidated, would China accelerate its economic reforms. We think this is unlikely but do expect a moderation of growth, with data momentum perhaps set to continue to slow at its current pace. Note how China's MCI tends to lead Citi's macro data index for China and our MCI is still tightening."

It gets worse.

As Capital Economics writes in its China Activity Monitor note this week, the firm's China Activity Proxy (CAP) suggests that growth in China slowed last month to the weakest pace in a year and with property sales cooling and officials continuing their efforts to rein in financial risks, Cap Econ thinks that looking ahead "the economy will slow further over the coming quarters."

Some more details from CapEco:

The CAP is our attempt to track the pace of growth in China without relying on the official GDP figures. It is based on a set of low-profile indicators chosen to reflect activity across a wide section of the economy. 

  • The CAP suggests that, following a sharp rebound in 2016, the economy expanded at a pace not far short of that shown on the official GDP data in the last three quarters. On a monthly basis though, we estimate growth actually peaked in July at 6.6% y/y before slowing to 5.6% last month, the weakest pace in a year. Growth also edged down last month in seasonally adjusted 3m/3m annualised terms, to 5.9% from 6.1% in August. 
  • The breakdown reveals that two of the CAP's five components were responsible for the latest slowdown. Passenger traffic growth fell in September to 1.6% y/y from 4.0% in August, hitting a six-month low. This may be due in part to distortions caused by the shift in timing of Mid-Autumn Festival from September last year to October this year. But even in seasonally-adjusted 3m/3m annualised terms, growth slowed from 4.0% to 3.5% last month.
  • Growth in domestic freight volumes also slowed in September in both y/y and annualised 3m/3m terms, with the latter hitting a three-month low. 
  • Property construction growth continued to rebound in September, reaching the fastest pace in almost three years despite the recent contraction in home sales. 

CapEco's ominous conclusion:

Looking ahead, we think growth will continue to slow over the coming quarters. The current props to growth appear shaky. With investment contracting in real terms, industrial output will probably soften over the months ahead. Property sales also look set to weaken further as the government's purchase curbs continue to expand. This will weigh on construction before long. More generally, with tighter monetary conditions weighing on credit growth, activity looks set to weaken further.

That the past 18 months of coordinated global growth will end in China, is quite symmetric: back in January 2016, as global markets were tumbling, aborting the Fed's plans to hike rates 4 times in 2016 and resulting in sharp economic slowdowns around the globe, it was the (still mysterious) Shanghai Accord that "saved" the world, and unleashed a burst of unprecedented, and coordinated, growth... which only cost China some $8 trillion in debt

It will only make sense that another major Chinese event will mark the top of this economic mini cycle, and lead to the next global downturn, not to mention spike in market volatility.

venerdì 27 ottobre 2017

This Will Cause The Crash (And It’s Not The U.S, China, Or The Fed)?


Many think, and it's reasonable, the iceberg that will ultimately sink the global Titanic is China. It has the greatest overbuilding and debt bubble in history, not to mention the obvious real estate and stock market bubbles.

But the Chinese government has too much control over its economy to just let it slide. No. China won't be the first domino to fall.

Rather, the dubious honor may go to our lovely and charming Italy.

We Italians are fun, laid-back people. Many love visiting our country. But would they bet on it? No way!

Italians think they've died and gone to heaven, but it looks more like hell's sneaking up on them!

Outside of Greece, Italy has the highest government debt: 130% of GDP and rising. Greece's government debt is at 180%, but at least Greece keeps getting bailouts, which it can get because it's small enough to have little impact on the euro.

But what if Italy starts defaulting?

Scratch that. What happens when Italy starts defaulting?

Default it will!

The country has the great majority of the bad loans in the eurozone. Look at this chart.


Of the worst countries in the eurozone, Italy dominates bad loans in the banking and private sector. It has 29% of the total, or $324 billion in bad loans – and that number continues to rise.

Major bank stocks there have already plummeted the most in recent years and are on government life support.

What makes Italy so dangerous is that French banks have the most outside exposure to these bad loans, with Germany taking second spot.

But ultimately Germany has the greatest exposure to a fall in Italy. It is the strongest exporter in Europe, especially to the highly indebted southern European nations.

The euro made that imbalance both possible and attractive. Strong exporters in northern Europe had more favorable exchange rates under the common euro, and the weaker importing nations could borrow more cheaply than under separate currencies.

Since Germany's exports are 46% of GDP, it has a strong incentive to keep floating these southern importers while criticizing them and forcing austerity at the higher political levels. It's called Target 2 loans. The German central bank (and others) simply defers payments from companies in Italy to some flexible future date.

It's like a company that gives more credit to their customers just to keep them buying… even though eventually those patrons will be able to repay a penny.


Look at this next chart.

Of the $839 billion in Target 2 loans from Germany's central bank, half, or $418 billion, are to Italy alone.

Given the potential to default on these loans and on foreign bank loans, Italy is strongly incentivized to leave the euro and default, just like Iceland did when it faced an equally dire situation.

A default, a much weaker local currency and higher inflation (from rising import costs) would mean that Italy's sovereign bonds would see a massive spike in rates. During the euro crisis, they went from 3% to 7%. This time it would be much worse!

But here's the most important point. Sovereign bonds around the world are overvalued with often negative yields long term (when adjusted for inflation).

Yet continued strong ECB bond buying and QE has put the Italian 10-year bonds yield at 1.85% versus U.S. Treasuries at 2.2%!

That's insane!

Italy is bankrupt, and we are the best house in this bad global neighborhood. Yet Italy's bonds are stronger than ours and yielding less.

How much badly could risk be miscalculated?!

When Italy gets in trouble again and bond yields spike, that will cause bondholders to question all sovereign bonds, even the trusted U.S. ones.

The bond bubble will seem to have topped and burst… but NOT.

Talk about volatility!

Bond yields could spike up across the world creating a global crisis and stock crash, and then, after a while, deflation will set in from the collapse of bubbles and debt deleveraging. Deflation will then cause the best sovereign (and corporate) bonds to fall in yields to even lower levels than today's unprecedented lows.

The bond bubble will continue next time for fundamental reasons, not artificial.

We're on a financial assets roller coaster ride and the exciting (treacherous?) section is just ahead. And it's going to be even hairier in traditionally safer and more stable bets like U.S. Treasury bonds.

Wall Street has a new consensus view that such yields can't go much lower and will rise modestly for years ahead, with mild rising inflation… a typical soft-landing view.

They will be wrong as usual, just like they'll be wrong on China.

Bid To Cover In Ugly, Tailing 7 Year Auction in USA

 two mediocre, tailing auctions, moments ago the Treasury sold $28 billion in 7 year paper in this week's final bond issuance and it was the ugliest of all.

Stopping at a high yield of 2.28%, this was a tail of 0.8bps - the first since July - to the 2.272% When Issued and the highest yield for 7Y paper since January. The Internals were ugly, with the Bid to Cover of 2.391 the lowest since August 2016, and sharply below September's 2.704, as well as the 2.57 past six auction average. 

The bidside was weak, with Indirects taking down 63.45%, the lowest since May and below last month's 70.64% as well as the 6 month average of 69.3%. Directs also declined from 18.95% in September to 13.31% this month, while Dealers were awarded 23.24% of the takedown, the highest since Jun and above the 6 auction average of 16.9%.

Overall, this was the ugliest auction of the lot, and may be an indication that US Treasury buyers, both domestic and foreign, are finally starting to lose their appetite.

giovedì 26 ottobre 2017

Does Yesterday's Selloff Have Legs?" - Morgan Stanley Answers

Does yesterday's modest - if sharp - selloff in stocks have legs? That is the question Morgan Stanley's Institutional Equity Division director Chris Metli asks in a note to clients overnight. As Metli writes, the moves have been exacerbated by the lack of protection investors have on and their rising equity exposures over the last month.

The below charts update the positioning in options and futures that QDS noted two weeks ago – in general investors have continued to get more bullish. Meanwhile, as MS Equity Strategist Mike Wilson has noted 3Q earnings are now largely in the price and with the SPX rally overextended, earnings season should be a 'sell the news' event as there is "greater risk for a correction than we've seen in a while".


So "does this move lower have legs?"

The above charts suggest that there are a good amount of recent positions put on that are offsides and need to come off, and that suggests that this may not just be a one-day move lower. As noted previously there is a lack of protection on in the 2400-2500 range so if the market can break 2500 there could be an 'air pocket' on the downside until there is ammo to actually buy the dip.


However, whether the market can move lower could come down to whether the consensus positions under the surface of the index (i.e. long / short trades) feel more pain and cause broad based de-risking.

The selloff will help clear out some of the faster money put to work recently, but the real pain would come from consensus long / short trades reversing (largely Tech vs Energy and cyclicals). As a proxy for this pain trade QDS tracks the MS Momentum baskets and the MS Passive basket (which tends to rally when active managers underperform). None of them are melting down, but their performance will be key to watch going forward.


As noted two weeks ago, as the end of year approaches the risk of unwinds should increase. Investors still benefit from a positive performance 'cushion' this year and most positions are in-the-money. But nobody wants to give that alpha back and underperform peers, meaning traders could be quicker on the unwind trigger from here on out. This should contribute to moderately higher volatility levels in general, and whether it accelerates into a full on pain trade will be driven by whether there is a catalyst. With Tech and Growth stocks the biggest crowded positions, earnings over the next week will be a key test.

With risks rising into the end of the year, but fundamentals still strong and still plenty of upside to MS Equity Strategist Mike Wilson's 2700 price target, QDS suggests:

Hedging QQQ (given crowding in Tech) and IWM (given tax reform risk) with ratio put spreads given volatility is relatively elevated in both vs SPX:

Buy QQQ Dec 145/140 1x1.5 put spreads for ~$0.50c (33 bps) which have a max risk / reward of 9x while not taking downside risk unless QQQ falls more than 12% to levels last hit in April
Buy IWM Dec 145/140 1x1.5 put spreads for ~$0.45c (30 bps) which have a max risk / reward of 10x while not taking downside risk unless IWM falls more than 12% to levels last hit in Nov 2016
Rotating long beta / broad-market positions into upside SPX calls (i.e. stock replacement)
Buy SPX Jan 2625 calls for ~50 bps, 8 implied vol

Mario Draghi Explains Why The ECB 'Taper' Is So Positive

Following the announcement of an 'as expected' dovish taper, markets have moved but not nearly as much as we suspect Mario Draghi would have liked. Therefore we expect him to drop a few tapebombs duiring the press conference in an effort to reassure 'investors' that 'whatever it takes' is still alive and well and buying negative-yielding bonds is still a no-brainer...

Draghi has not surprised, and is following the dovish QE taper announcement earlier, although the Q&A will likely be interesting. 

Draghi is emphasizing that rates will not be changing until "well past" the end of QE, and reiterates the terms of the QE tapering (EUR30bn per month, until September 2018). Draghi discussed inflation, highlighted that domestic prices pressures "remain muted", and even that inflation is "slowing, due to energy-price effects". He also said that "core inflation has yet to show convincing upward trend"

Still, he does note that "wage growth has increased somewhat" and as some have noted there has been an interest addition to the language, namely "very substantial" has been subtly changed to "ample" with regards to necessary stimulus.

Here are the key headlines: 
DRAGHI SEES RATES AT PRESENT LEVEL WELL PAST END OF QE 
DRAGHI: ECB WILL REDUCE MONTHLY BOND BUYING TO EU30B IN JAN. 
DRAGHI SAYS ECB WILL BUY BONDS UNTIL AT LEAST SEPT. 
DRAGHI REITERATES PLEDGE TO BOOST QE IN SIZE, LENGTH IF NEEDED 
DRAGHI SAYS ECB WILL REINVEST FOR EXTENDED PERIOD AFTER QE END 
DRAGHI SAYS REINVESTMENTS WILL HELP DELIVER APPROPRIATE STANCE 
DRAGHI EXTENDS FULL ALLOTMENT IN REFIS THROUGH END 2019 
DRAGHI SAYS DECISIONS WILL PRESERVE FAVORABLE CONDITIONS 
DRAGHI SAYS DOMESTIC PRICE PRESSURES REMAIN MUTED 
DRAGHI SAYS RECALIBRATION OF QE REFLECTS CONFIDENCE ON PRICES.