MARKET FLASH:

"It seems the donkey is laughing, but he instead is braying (l'asino sembra ridere ma in realtà raglia)": si veda sotto "1927-1933: Pompous Prognosticators" per avere la conferma che la storia non si ripete ma fà la rima.


martedì 23 gennaio 2018

Bob Shiller Warns World's "Priciest Stock Market" Could "Absolutely Turn Suddenly"

Nobel Prize-winning economist Robert Shiller told CNBC Tuesday that a market correction could come at any time and without warning...

"People ask 'well what will trigger [a market correction]?' But it doesn't need a trigger, it's the dynamics of bubbles inherently makes them come to a sudden end eventually..."

Shiller, who won the Nobel Prize for Economics in 2013 for his work on asset prices and inefficient markets, said that markets could "absolutely suddenly turn" and that he believed the bull market was hard to attribute totally to the U.S. political scene.

"The strong bull market in the U.S. is often attributed to the situation in the U.S. but it's not unique to the U.S. anyway, so it's hard to know what the world story is that's driving markets up at this time, I think it's more subtle than we recognize,"

Additionally Shiller writes in Project Syndicate that it is impossible to pin down the full cause of the high price of the US stock market, warning that this fact alone should remind all investors of the importance of diversification, and that the overall US stock market should not be given too much weight in a portfolio.

The level of stock markets differs widely across countries. And right now, the United States is leading the world. What everyone wants to know is why – and whether its stock market's current level is justified.

We can get a simple intuitive measure of the differences between countries by looking at price-earnings ratios. I have long advocated the cyclically adjusted price-earnings (CAPE) ratio that John Campbell (now at Harvard University) and I developed 30 years ago.

The CAPE ratio is the real (inflation-adjusted) price of a share divided by a ten-year average of real earnings per share. Barclays Bank in London compiles the CAPE ratios for 26 countries (I consult for Barclays on its products related to the CAPE ratio). As of December 29, the CAPE ratio is highest for the US.

https://www.zerohedge.com/sites/default/files/inline-images/20180123_shiller.jpg

Let's consider what these ratios mean. Ownership of stock represents a long-term claim on a company's earnings, which the company can pay to the owners of shares as dividends or reinvest to provide the shareholders more dividends in the future. A share in a company is not just a claim on next year's earnings, or on earnings the year after that. Successful companies last for decades, even centuries.

So, to arrive at a valuation for a country's stock market, we need to forecast the growth rate of earnings and dividends for an interval considerably longer than a year. We really want to know what the earnings will do over the next ten or 20 years. But how can one be confident of long-term forecasts of earnings growth across countries?

In pricing stock markets, people don't seem to be relying on any good forecast of the next ten years' earnings. They just seem to look at the past ten years, which are already done and gone, but also known and tangible.

But when Campbell and I studied earnings growth in the US with long historical data, we found that it has not been very amenable to extrapolation. Since 1881, the correlation of the past decade's real earnings growth with the price-earnings ratio is a positive 0.32. But there is zero correlation between the CAPE ratio and the next ten years' real earnings growth. And real earnings growth per share for the S&P Composite Stock Price Index over the previous ten years was negatively correlated (-17% since 1881) with real earnings growth over the subsequent ten years. That's the opposite of momentum. It means that good news about earnings growth in the past decade is (slightly) bad news about earnings growth in the future.

Essentially the same sort of thing happens with US inflation and the bond market. One might think that long-term interest rates tend to be high when there is evidence that there will be higher inflation over the life of the bond, to compensate investors for the expected decline in the dollar's purchasing power. Using data since 1913, when the consumer price index computed by the US Bureau of Labor Statistics starts, we find that the there is almost no correlation between long-term interest rates and ten-year inflation rates over succeeding decades. While positive, the correlation between one decade's total inflation and the next decade's total inflation is only 2%.

But bond markets act as if they think inflation can be extrapolated. Long-term interest rates tend to be high when the last decade's inflation was high. US long-term bond yields, such as the ten-year Treasury yield, are highly positively correlated (70% since 1913) with the previous ten years' inflation. But the correlation between the Treasury yield and the inflation rate over the next ten years is only 28%.

How can we square investors' behavior with the famous assertion that it is hard to beat the market? Why haven't growing reliance on data analytics and aggressive trading meant that, as markets become more efficient over time, all remaining opportunities to secure abnormal profits are competed away?

Economic theory, as exemplified by the work of Andrei Shleifer at Harvard and Robert Vishny of the University of Chicago, offers ample reason to expect that long-term investment opportunities will never be eliminated from markets, even when there are a lot of very smart people trading.

This brings us back to the mystery of what's driving the US stock market higher than all others. It's not the "Trump effect," or the effect of the recent cut in the US corporate tax rate. After all, the US has pretty much had the world's highest CAPE ratio ever since President Barack Obama's second term began in 2013. Nor is extrapolation of rapid earnings growth a significant factor, given that the latest real earnings per share for the S&P index are only 6% above their peak about ten years earlier, before the 2008 financial crisis erupted.

Part of the reason for America's world-beating CAPE ratio may be its higher rate of share repurchases, though share repurchases have become a global phenomenon. Higher CAPE ratios in the US may also reflect a stronger psychology of fear about the replacement of jobs by machines. The flip side of that fear, as I argued in the third edition of my book Irrational Exuberance, is a stronger desire to own capital in a free-market country with an association with computers.

The truth is that it is impossible to pin down the full cause of the high price of the US stock market.

The lack of any clear justification for its high CAPE ratio should remind all investors of the importance of diversification, and that the overall US stock market should not be given too much weight in a portfolio.

"Tax Reform Is Now Fully Priced In"

Last week we showed that as part of the "new tax cut reality", 2018 EPS forecasts have soared in the past few weeks as analysts scrambled to boost their earnings forecasts for companies benefiting from the lower corporate tax rate. Well, as of today, that surge has made further headway, and as the latest Bank of America chart below shows, the S&P is now trading off a year end EPS forecast of roughly 152, nearly 7 points higher compared to October.

asd

Further, according to BofA estimates, the surge in year end EPS forecasts means that about 40-50% of the tax reform's benefit of $13 EPS is now backed in.

That, however, has prompted more concerns out of Morgan Stanley, which as a reminder last week  suggested that with S&P calls hitting an all time high, it is time to buy puts. Fast forward to today, when in a note released from Morgan Stanley's Mike Wilson, the chief equity strategist writes that he continues to hear both clients and commentators suggest that tax cuts have not been priced and the powerful extension of the rally the past few weeks has only emboldened those with that view.

Morgan Stanley then admits that "we have been surprised at how fast forward EPS estimates have moved up post the signing of the tax deal. We thought it would be more gradual as companies hesitated to provide clear and detailed guidance on how tax would affect 2018 EPS, or indicated that it might not be as exciting as some were hoping--like FAST and AXP."

Furthermore, as a counter to Bank of America, the exhibit below from Morgan Stanley shows "just how much has now been discounted with the almost parabolic move higher in forward S&P EPS from $145 to $152 in just 3 weeks."

Wilson then suggests that contrary to BofA's take, the tax cut is not only fully priced in, but the next move will be lower as multiples start to contract:

We have no beef with this increase and is generally in line with our estimate that tax cuts would add somewhere between $5-10 per share to S&P 2018 EPS. However, we are skeptical it will exceed $155 when all is said and done. Meanwhile, the multiple has also been rising suggesting the market is now expecting a further rise toward $155 or higher.

asd

And to underscore his bearish take on the ongoing meltup, Morgan Stanley's strategist writes that this strongly suggests that the "tax is fully priced, especially if one agrees with our view that multiples are likely to fall when the earnings revisions stop rising and investors recognize it's lower quality growth and they are staring at a massive deceleration in 2019--$155 2018 EPS implies close to 17% y/y growth. Based on that, we are hard pressed to see much more than 5% earnings growth in 2019 even if the late cycle economic expansion continues; hardly a foregone conclusion in our view."

Central Banks: From Coordination to Competition

This is one reason why I anticipate "unexpected" disruptions in the global economy in 2018.
The mere mention of "central banks" will likely turn off many readers who understandably have little interest in convoluted policies and arcane mumbo-jumbo, but bear with me for a few paragraphs while I make the case for something to happen in 2018 that will impact us all to some degree.
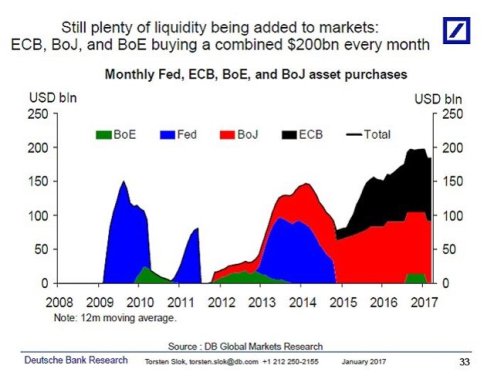
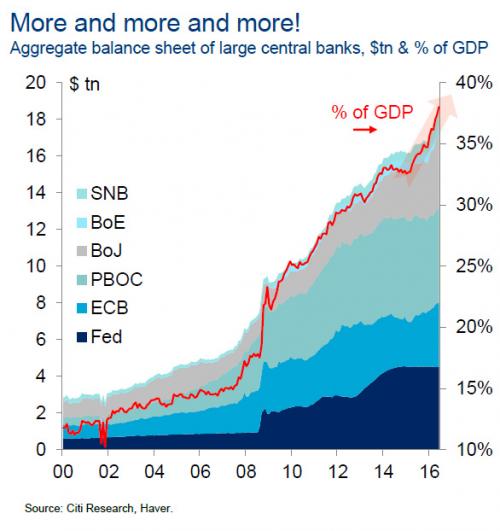
That something is the decay of the synchronized central bank stimulus policies that have pumped trillions of dollars, yuan, yen and euros into the global financial markets over the past nine years. Here are two charts that depict the "tag team" coordinated approach central banks have deployed: when one CB tapers its stimulus, another ramps up its money-creation/asset-purchases stimulus:
The balance sheets of all the primary central banks added together is astronomical:
This team effort is motivated by self-interest, of course; no one central bank can reflate the entire global economy, and yet that is the only way to reflate each nation/bloc's own economy, given the global connectedness of the modern economy.
But the threads of mutual self-interest are fraying. At this late stage in the credit cycle, the central banks must begin "tapering", i.e. diminishing and then ending their stimulus policies and eventually reducing their balance sheets by selling assets they bought in the stimulus phase (or simply stop replacing bonds they own that mature).
The Federal Reserve was first out of the gate in launching quasi-unlimited bond purchases, and it was the first central bank to cease stimulus (quantitative easing) and raise interest rates. It has now signaled that it will begin selling assets (i.e. stop replacing bonds that mature).
Those currencies/bonds that pay the highest interest (accounting for inflation, of will naturally attract global capital seeking a safe return above zero.
The net effect of this differentiation is that nations/blocs with near-zero yields will experience capital flight as money will flow to higher yields elsewhere.
The coordination of the stimulus phase will give way to nationalist self-interest in the tightening phase.
Those nations/blocs that need super-easy money and near-zero interest rates to keep their "growth" afloat will be drained of capital as capital goes to wherever it can earn more yield.
There's a further complicating factor: the relative strength of each nation's currency. This matters because as a currency appreciates, the issuing nation's exports cost more to buyers using their own currencies, and the nation with the appreciating currency loses the competitive edge of a cheap currency.
Since higher interest rates attract capital, they also tend to strengthen one's currency, as the relative value of currency is set by supply and demand: the more demand there is for the currency, the higher it goes relative the field of competing currencies.
There is a third factor as well: central banks need to reduce their balance sheets and raise interest rates, so they have some "policy accomodation" available to counter the next (and inevitable) recession/financial crisis.
The US has so far managed a hat-trick: it has raised interest rates a number of times, yet its currency, the US dollar, has lost over 15% of its value in 2017 compared to the Euro, which has gained 15+%.
There is a Darwinian twist to all this: any nation/bloc which manages to raise rates and end central bank stimulus without stifling its "recovery" or strengthening its currency to the point it hurts exports, and still be a global magnet for capital due to higher yields/rates, will have a substantial competitive advantage over its peers.
In effect, the self-interest that bound the central banks together in the stimulus phase reverses in the tightening/normalizing phase. Thus I anticipate a slow decay of central bank coordination and a rise of conflict/ competition, though this will of course be kept out of the media.
This is one reason why I anticipate "unexpected" disruptions in the global economy in 2018, as the coordinated stimulus phase ends and the disruptive, messy, Darwinian phase of tightening/ normalizing rates and balance sheets gathers momentum. 

lunedì 22 gennaio 2018

Believing The Impossible. Is necessary to rationalize today's bubble markets.

"Alice laughed: "There's no use trying," she said; "one can't believe impossible things."

"I daresay you haven't had much practice," said the Queen. "When I was younger, I always did it for half an hour a day. Why, sometimes I've believed as many as six impossible things before breakfast."

~ Lewis Carroll, Through The Looking Glass

To borrow from Lewis Carroll: To have confidence in today's central bank-created bubble markets, we have to believe in six impossible things.

Thing 1: Fundamentals Don't Matter.

In our brave new world of money printing to infinity, we're supposed to buy into a "new paradigm" story. You know, that It's different this time.

Spoiler alert: It never is.

Companies either make money or they don't. They're either good investments or they aren't. They'll either return risk-adjusted cash to you over time, or they won't.

Here's a simple exercise. Using a publicly available stock screener at Finviz.com, a favorite site of mine, I set two filter parameters to obtain a list of companies that have::

  1. A market cap of over $2B
  2. A P/E ratio in excess of 50x

These are the biggest companies that, in theory at least, require investors to wait 50 years (or more) to be paid back in profits for each dollar invested.

236 companies fit this description right now. 236!

Here's a screenshot of page 11 of the results. Every company listed here has a P/E multiple of over 190(!). 

(Source – here's the exact screen I used, so you can troll the results for yourself)

Again, these sky-high ratios mean that investors are willing to wait more than 190 years for these companies to earn back their principal at current stock earnings prices.

In a word, folks, this is nuts. Not even during the height of the 2000 and 2007 bubbles could we find such an enormous number of extreme results spread across every sector as we see today. The small selection in the table above includes companies from the stodgy food, machinery, energy, and insurance sectors, also joined by traditional high-fliers like biotech and internet.

This is exactly the sort of indiscriminate optimism that identifies a late-stage classic bubble market. Nothing can ruin the party vibe. Anything and everything is priced beyond perfection. Each sector has its own story to rationalize the exuberance. "Oh, energy is poised to rebound soon, and Amazon has monopoly pricing power that will never be challenged, and Netflix is investing in premium content, and food, well, uh, food…you know, this particular company is special…maybe a takeover target?"

In the table above, I've highlighted a few companies in yellow just as conversation starters.

Let's start with Yelp. I don't even grasp how Yelp deserves a P/E of more than 15, let alone 192. Its business model of using crowd-sourced reviews to drive eyeballs/traffic to sell advertising against is facing competition from every possible direction. Google is squeezing them on every front, and new apps come along daily to parse the same review & locator territories.

Schlumberger is not a soon-to-recover story. Even if it were, that doesn't help to justify the 21 other oil & gas companies returned for this particular filter I ran. Taken together, seeing so many super-high P/E companies from this sector is difficult to explain -- outside of the markets throwing all caution to the wind.

Netflix is almost a special case of willful investor denial, similar to Twitter, Uber, and Amazon. In each case "investors" have waited year after year after year for earnings to finally materialize, but none do. Worse, it's been nothing but a steady parade of red ink.

Does this look like the sort of explosive earnings growth you'd want to see to justify a P/E of 220?

(Source)

And those are "earnings", which are easily doctored by accounting gimmickry into telling a picture rosier than true reality. Netflix's cash flow burns are much better at showing how colossally this company loses money:

Quarterly burn rates in excess of $500 million are not the sign of a maturing, successful company. This is a company that is completely dependent on continued access to new inflows of funds from generous suckers -- ahem!, investors -- in the capital markets.

If those inflows stop and the company have to actually earn positive results from what it has already built, then Netflix would have to abandon its current cash-bleeding business model. In a more normal market environment, such pause would justify a P/E ratio of perhaps 1/10th the current ratio of 220.

And one last example to show that stocks are not the only asset class experiencing a price bubble. Without getting bogged down too much into the details of bonds, seeing Greek 2-year debt trading today with a lower yield (i.e. a higher price) than US 2-year Treasury debt tells us that similar massive price distortions exist in the bond markets as well.

The bottom line here is that fundamentals have been entirely tossed out the window. To believe in today's asset prices you have to believe in a future so bright and full of explosive growth that it's literally going to eclipse every other growth period in all of modern history.

In other words, you have to believe that This time is different.

Thing 2: You Can Print Prosperity.

For nearly a decade now, central banks have been pretending they are printing up prosperity.

Our weak-minded and subservient media has been dutifully parroting these claims, even though they're easily refutable by anyone willing to do a little fourth-grade math. 

Money printing can only ever do one thing: take from one group while giving to another. It's wealth redistributive, not additive.

As I've frequently said, if it were possible to create true prosperity by printing money, the Romans would have succeeded long ago and we'd all be speaking Latin. 

But the common narrative we're being told/sold is that financial markets are going up because more wealth is being created. Metrics like record total market capitalization and home values are used endlessly on the airwaves as unassailable proof of the "everything is awesome" meme.

But even a cursory examination of the underlying data reveals that these increases in price are not the same as an increase in wealth. In fact, the efforts of the central planners result in an increasingly unfair distribution of wealth, where the rich get richer at the expense of everyone else.

For example, savers are losing, while equity holders are gaining. That's a redistribution forced upon the system by central banks that have crammed interest rates to never-before-seen 5,000 year lows while also directly supporting stock prices by buying them. Yes, Virginia, purchasing financial assets with freshly-printed thin-air money spikes their prices higher .

Is that the same as creating wealth? No. Not at all.

Thing 3: Currency, stocks and bonds are "wealth."

We have to accept with the very simple, but difficult, concept that wealth is not money. It's not currency either. And it's not debt, it's not stocks, and it's not Bitcoin. Those are all claims on wealth.

Real wealth is real things. Land, food, cars, houses and other tangible and/or productive assets that we can use or consume.

We use markers to make claims on real wealth. Those claims are always, by definition, in the future.

For example, if I have a pocket full of money, I don't have to worry about going hungry. I can always exchange my money for food later on when I am hungry. I use my claims on wealth as convenient placeholders for when I want to consume or use something later on, in the future.

By way of example, suppose you're starving but your pocketful of money can't buy any food because none exists in the stores. How much "wealth" would you say you have in that situation? A lot, some, or none?

This very circumstance faces many people in Venezuela right now. People who recently believed themselves to be wealthy because they had money suddenly discovered to their dismay that holding those claims is not at all the same thing as holding real wealth.

(Source)

At Peak Prosperity, we classify wealth into three categories: primary, secondary and tertiary.

Primary wealth is sourced from the land. It is rich soils, thick stands of timber and abundant reserves of ores and fossil fuels in the ground.

Secondary wealth is the means of production that has been extracted and/or converted from primary wealth and brought to market. It's lumber, steel, food in the grocery store, and factories.

Tertiary wealth, better known as 'paper wealth' (stocks, bonds, etc), is merely a claim on either primary and secondary wealth. Without either of those two forms of wealth, tertiary wealth has no value.

It was only recently that people somehow forgot this simple logical progression. Two hundred years ago, the answer to the question "Who are the wealthiest people around here?" was as simple as pointing to those who owned the most land (primary) or factories and stores (secondary).

But after 50+ years of intellectually-bankrupt experiments with "financialization", people have entirely lost this thread and now confuse wealth with claims on wealth. Today the "wealthiest" are far too often composed of the skimmers and grafters that best learned how to exploit an ill-advised system of exponential credit expansion.

In order to believe in this system you have to believe that true wealth is created by the financial system, rather than by hard working people who take risks and deploy their talents to convert primary wealth into secondary wealth.

That just isn't the case.

Thing 4: The World Is Infinite.

To believe in the endless expansion of claims on wealth (i.e. that ever-rising stock and bond prices are rational) means that you also have to believe that the world is infinite.

To explain why, let's take a closer look at debt. Total credit market debt has been expanding exponentially in recent decades.

In order to believe the recent narrative of continued credit expansion alone (leaving aside the exponentially growing equity claims for the moment) you have to believe that somehow, magically, it's possible to increase claims on wealth faster than actual real wealth…forever:

In the above chart, the green dotted line tracks the increase in global GDP while the blue dotted line tracks the increase in global debt. (Note: we're not including here under-funded liabilities such as pensions and entitlements which, if we did, make this story approximately 4x worse).

We can easily see that credit has been increasing much faster than GDP. This is an impossible, unsustainable condition -- mathematically certain to end in tears. Yet everyone is pretending as if we'll be able to continue this way perpetually, with no consequences.

Any grade-school child can work out the bad math involved here. It's simply impossible for your debts to rise at a faster rate than your income forever.

So to be a believer in the current market's valuations and trajectory, you have to believe in a world with "no limits".

Thing 5: History Doesn't Matter.

In every single case throughout history when claims on wealth have badly exceeded the real wealth itself, the claims have devauled. Usually quite painfully so.

World wars have resulted as a consequence. As have dark periods of great economic depression.

The core model of the central banks is predicated on endless growth on a finite planet. Do try your best to overlook the fact that hundreds of ecological warning lights are flashing bright red and clearly indicating the even more exponential growth is precisely what is not needed at this moment in history. Missing insects, bleaching coral reefs, eroding topsoil, plunging counts of everything from human sperm counts to oceanic phytoplankton, and plummeting migratory bird counts are all saying the same thing: the old economic model of endless growth is now destroying itself.

But this time we're supposed to believe that the lessons of history and scientific data don't apply to our unique situation in time. Our moment is special; magically so. This time is different.

It's never different.

Thing 6: They Know What They're Doing.

A central theme of the dominant narrative is faith in authority. Our leaders have everything under full control.

Well, after watching the central banks get things wrong over and over again for decades, it's quite impossible for me to believe that they suddenly have everything right.

They famously claim to not be able to spot bubbles in advance. They also firmly assert we are not experiencing an asset bubble now. Of course, they said the same thing right before the housing bubble burst in 2007.

This is just how large bureaucratic organizations operate. The toadies say what they think their bosses want to hear, and the higher ups are pleased to have someone to blame when things go awry.

But now, suddenly, as the central banks are conducting a massive globally-coordinated expansion of the world money supply at a magnitude higher than anyone has ever imagined, we're supposed to believe that now they've suddenly got everything under control and correctly divined?

Yeah, sure.

Interest rates have never in all of human history been this low. There's no guide to steer by. But don't worry – the central banks will get it exactly right this time. This time is different.

Further, negative nominal interest rates such as we see in the many trillions today, are not so much a monetary experiment as they are social engineering. The price of money is a very important social signal. What does it even mean that money has a negative price? Having to pay to lend your money has unknowable impacts on decision-making by businesses, banks and individuals. Could anyone truly have had an accurate prediction of what the implications would be?

Well, the results of this experiment are in and have been for years. Rather than spurring spending as the Bank of Japan supposed, negative interest rates spurred saving. Rather than driving corporate investment as the ECB imagined, negative rates instead drove corporate borrowing which was then spent on stock buy-backs and other financial gimmickry.

Now I can't fault the central banks for trying something new; but I can fault them for failing to adjust after it became obvious the effects were deleterious and other than intended. How much longer should we permit these same fallible central banks to continue unchallenged as the stakes get increasingly higher?

In conclusion, it's impossible for me to believe that the central banks know what they're doing.

Shifting From The Impossible To The Probable

Look, either I have all this very badly wrong, or I don't.

If I do, that means that this time is indeed different, that it's possible to print up prosperity, that history doesn't matter, that fundamentals don't matter, that the world really is infinite, and that the central banks know exactly what they're doing.

If I'm wrong, I'll have to carefully reexamine all of my data and assumptions to find out where the error(s) lay. And issue a very humble public apology. Oh, and then go long the market.

But if I'm right, and I really would prefer not to be, then a brutal market collapse is nigh. One that may well end in war, ecosystem breakdown, or financial Armageddon -- possibly all three.

Remember that bubbles end remarkably quickly. When they burst, their job is to create the greatest misery possible for the greatest number of people possible. 

The only way to avoid that fate is to be positioned wisely in advance. Take steps now to ensure you're one of those prudent few.

The US Equity Market Has Never Done This Before

Three charts to consider ahead of Monday's post-Government-Shutdown open.

VALUE
The S&P 500 is trading at a Price-to-Sales ratio of 2.35x... a new record high for valuation...
GREED
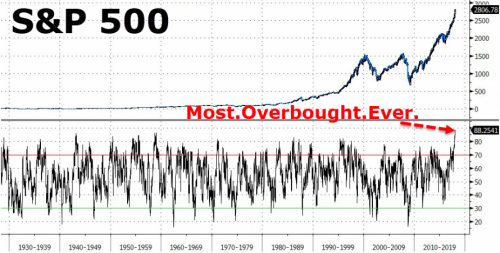
The S&P 500 is up 8 of the last 9 weeks, 16 of the last 19 weeks, and 15 of the last 15 months (and 22 of the last 23 months - since The Shanghai Accord). This has pushed The S&P 500 to an RSI of 88.4... a new record high for overbought...
FEAR
The S&P 500 has averaged about four 5% declines - from peak to trough - annually since 1927, but volatility in US stocks has evaporated in recent years. Amid a reportedly robust global economy and still supportive global monetary policy, Friday's 0.4% gain meant that the S&P 500 extended its streak to 395 days without a 5% reversal... a new a new record for tranquillity...
As The FT notes, the last time the S&P 500 suffered a 5 per cent setback was in the global market carnage that followed the UK's shock vote in June 2016 to leave the EU, which constitutes the last significant, if brief, bout of volatility in markets. The last time the US stock market suffered an actual correction - typically defined as a drop of over 10 per cent from the recent peak — was in early 2016, when investors' anxiety grew over the state of China's economy.
Some investors and analysts fear that the tranquillity is encouraging investors to stop buying protection against declines, or to making aggressive "short" bets on volatility staying low through complicated derivatives - which could exacerbate any turbulence that might erupt.
Underscoring the combination of ebullience and simmering fears, Bank of America Merrill Lynch's latest investor survey indicated that most fund managers think the bull market will continue into 2019, but said that "short volatility" was the most crowded trade in markets.
"The short volatility trade remains strong - even though it is a huge potential risk," Mark Tinker, a fund manager at Axa Investment Managers, noted this week. "Keep an eye on low volatility," he urged, "it's less a sign of complacency and more a sign of too many people chasing income and selling volatility."

domenica 21 gennaio 2018

Mitch McConnell: "This Shutdown Is About To Get A Lot Worse"

Despite assurances from the House that an even shorter-term spending bill that would give lawmakers more wiggle room to negotiate would be a non-starter, Susan Collins and a group of moderate senators told reporters they are taking ideas about a short-term fix to the Republican senate leadership...

Both the House and Senate have reconvened for another rare weekend session.

Meanwhile, House Speaker Paul Ryan took to the Sunday shows to heap blame for the shutdown on Democrats.

"You can't blame Donald Trump for Senate Democrats shutting down the government. They shut down the government with no endgame in sight," House Speaker Paul Ryan said on CBS News' "Face The Nation."

Democrats, meanwhile, have dubbed the stalled negotiations the "Trump shutdown," and say the GOP's control of both the White House and Congress puts the blame squarely on their shoulders, per NBC News.

McConnell has scheduled a procedural vote on a three-week extension bill for 1 am Monday morning. If passed, that bill would need to clear the House. Ryan has said he would support the bill, which would keep the government open until Feb. 8. The original four-week plan offered to keep the government open until Feb. 16.

"This shutdown is going to get a lot worse tomorrow," Senate Majority Leader Mitch McConnell said in a speech opening the Senate floor. "Today would be a good day to end it."

Senate Minority Leader Chuck Schumer called on President Trump to return to the bargaining table. "I'm willing to seal the deal, to sit and work right now, with the president or anyone he designates. Let's get it done."

"This is the Trump shutdown, only President Trump can end it." Schumer said. "We Democrats are at the table, ready to negotiate. The president needs to pull up a chair and end this shutdown."

As NBC News explained, Democrats maintain that the weeks-long spending bill being considered in the Senate is just a stalling tactic that will not lead to a serious legislative debate about immigration reform. Democrats have vowed not to vote for a spending package until a deal to enshrine DACA protections for 690,000 undocumented immigrants is in place.

* * *

Update: Amid reports that Trump hasn't spoken with Chuck Schumer since Friday, Sen. Dick Durban refused to offer a prediction about when the shutdown might end.

"I'm not going to make that prediction," Durbin said on NBC's "Meet the Press."

"We're going to look every minute of every day," Durbin said on Sunday, adding that he wanted President Trump to get involved in the negotiation process.

Durbin added he feels there are "positive conversations" happening amid the negotiations (even if the president and the minority leader aren't participants in those conversations).

The shutdown is set to impact workers on Monday, many of which will be furloughed if they are deemed non-essential by the government.

* * *

While Congressional leaders and the White House have assured the public that the federal government shutdown that technically began at 12:01 am ET Saturday morning could be over within 24 hours, Mick Mulvaney, the director of the Office of Management and Budget and a key player in the White House's negotiations, told Fox News Sunday what many - including us - expect will be the case: The government shutdown could persist for weeks...

Mulvaney said Democrats want to keep the government shut for Trump's Jan. 30 State of the Union address. The beginning of the shutdown also coincided with the anniversary of Trump's swearing-in.

As we've pointed out, both of the two most recent shutdowns lasted for two weeks or longer, per Axios.


Shutdown

Mulvaney argued that the present shutdown differed from the 2013 Obama-era shutdown in that the Democrats want to support the Republicans' stopgap.

Global Market Momentum Just Hit Extreme Levels; Profit-Taking Imminent

According to the latest fund flow data, anecdotal speculation of a marketwide melt-up was indeed the case. As a reminder, market optimism among both professional and retail investors had hit the highest level since just before the crash of 1987...


... with a recent E-Trade survey disclosed that 8 out of 10 retail investors - the highest on record - were certain that stocks would continue to rise in Q1. Then, BofA calculated that the 4-week inflows into equities was not only "thundering", it was the largest ever. This is the result of a massive $23.9bn weekly inflow into equities which brings the 4-week inflow to stocks to the biggest ever, $58bn as shown in the below...


and there was even some good news for active managers: the 4-week inflows to active equity funds was at a 4-year high, although the relentless market share theft by ETFs is unlikely to change any time soon, and certainly not if the market keeps levitating with virtually no volatility.

Also on Friday the S&P's Relative Strength Indicator rose to a new all time high, suggesting that as of this moment, the US stock market is the most overbought ever.


Now it's JPMorgan's turn to opine on recent market euphoria, which - in the aptly named weekly "Flows and Liquidity" report, arguably JPM's most interesting publication - it says that as of Friday, "momentum signals have reached extreme levels for the S&P" which to JPM's Nikolaos Panigirtzoglou suggests that "equities are vulnerable to near-term profit taking."

Why? JPM observes that after revisiting the bank's momentum-based indicators, shown in Tables A5 and A7 below which it uses to infer how CTAs and other momentum-based investors are positioned across various commodities as well as equity indices, US sectors, bond futures and currency pairs....


... JPM noted that "momentum was approaching extreme levels in the S&P 500, along with the Nikkei as well as crude oil futures."


The tables reveal, that in the just passed week, the continued strong momentum in risky asset prices saw the z-score of JPM's S&P signal triggering the mean reversion overlay on Thursday after pointing to longs for around a year and a half.

This means that at long last, the market "could be at levels where momentum-based investors would begin to take profit on their positions."

Additionally, the continued sell-off in bond markets has seen z-scores for US Treasury futures shift further into negative territory, "but they remain some way away from extreme levels." Finally, for oil, momentum retraced some of the recent strong gains after Brent oil prices declined from a peak of just over $70 per barrel, though as Chart A39 in the Appendix shows speculative.

To recap: CTAs and other momentum-factor based investors are now at and beyond levels where they traditionally take profits. This could start happening as soon as next week, especially should the market be spooked by the uncertainty surrounding the government shutdown, which as Goldman said yesterday "could last a few weeks", and near the date of the US debt ceiling D-date, some time in early March, by which point stocks will really sell off if there still is no funding deal.

Draghi’s Membership in Murky G30 Financial Group Under Fire


A private club for central bankers, regulators, and bankers.

On Wednesday, ECB President Mario Draghi suffered the rare ignominy of being criticized in public by the EU's Ombudsman, Emily O'Reilly, whose job it is to arbitrate public complaints about EU institutions. The complaint against Draghi was that he had compromised his public role by regularly attending the Group of 30, a secretive club of corporate and central bankers.

In her response to the complaint, O'Reilly recommended that Draghi should suspend his membership of the group for the remaining duration of his term.

"The implied closeness of the relationship through membership – particularly between a supervising bank and those it supervises – is not compatible with the independence obligation of an institution such as the ECB," O'Reilly said.

Previously called the Consultative Group on International Economic and Monetary Affairs, the Group of 30 (or G30) is a Washington DC-based private group whose members consist of central bank governors, private sector bankers and academics. Membership is by invitation only.

Its current membership list reads like a Who's Who of global finance. It includes current and former central bankers, many of whom now work or worked in the past for major financial corporations, such as:

  • Mario Draghi (ECB, Bank of Italy, Goldman Sachs)
  • Ben Bernanke (former Chairman of the Federal Reserve)
  • William Dudley (New York Fed, Goldman Sachs)
  • Timothy Geithner (Warburg Pincus, former US Treasury Secretary, New York Fed)
  • Mark Carney (Bank of England, Bank of Canada, Goldman Sachs)
  • Axel Weber (UBS, ECB, Bundesbank)
  • Haruhiko Kuroda (Bank of Japan)
  • Christian Noyer (Bank for International Settlements, Bank of France)
  • Jaime Caruana (Bank for International Settlements)
  • Agustín Carstens (Bank for International Settlements, former Chairman of Bank of Mexico)

It also includes senior representatives of financial corporations with subsidiaries supervised by the ECB, including:

  • Gail Kelly (UBS)
  • Tidjane Thiam (Crédit Suisse)
  • E. Gerald Corrigan (Goldman Sachs)
  • Jacob Frenkel (JP Morgan Chase, Bank of Israel)
  • Philipp Hildebrand (BlackRock, Former Chairman of the Governing Board, SNB)

And it includes economists such as Lawrence Summers, Paul Krugman, and Kenneth Rogoff.

While the group prides itself on being a well-intentioned forum for "deepen(ing) understanding of international economic and financial issues," its abject lack of transparency makes it an ideal setting for the trading of insider information or favors.

"The transparency standards of the G30 fall below the standards applied by the ECB in the context of other fora, or even the transparency standards applied by the G30 at the time of the Ombudsman's first G30 case in 2012," notes the Ombudsman's report. Of the G30's board of trustees only the identity of its chair, Jacob A Frenkel, the chairman of JPMorgan Chase International, has been made public.

At a G30 meeting last year, Draghi apparently met with representatives of Credit Suisse, Deutsche Bank, BridgeWater Associates, BlackRock, Morgan Stanley, Munich Re, and AXA. If they were given indicators of future ECB policy or actions, they would have huge risk-free opportunities to enrich themselves as well as huge advantages over all other market participants, including their biggest rivals. This is what prompted the Brussels-based NGO Corporate Europe Observatory (CEO) to lodge a complaint with the EU Ombudsman against Draghi's membership of the Group of Thirty.

While O'Reilly said there was no evidence of sensitive information being shared at the G-30, there could still be "a perception that, through the participation of members of the ECB's decision-making bodies, the ECB could be open to influence in the shaping of new regulatory practices." And it's not as if the ECB hasn't already got into hot water over sharing sensitive information with market players in other settings, such as when hedge funds at a London conference were warned that the ECB would be ramping up its QE program hours before the rest of the market.

For the ombudsman, the mere perception of impropriety is cause enough for concern. "Any lack of transparency could create a public impression of secrecy, which would reflect negatively on the image and reputation of the EU's decision-making bodies, including the ECB," O'Reilly said.

In light of this risk, O'Reilly not only requests that Draghi immediately end his membership of the G-30; she also calls for a complete ban on all future presidents of the ECB taking up membership of the club. The mere fact that the ECB has allowed its membership of the G-30 to taint its perceivedinstitutional independence is tantamount to maladministration, she said:

"The ECB takes decisions that directly affect the lives of millions of citizens. In the aftermath of the financial crisis, and in consideration of the additional powers given to the ECB in recent years to supervise member state banks in the public interest, it is important to demonstrate to that public that there is a clear separation between the ECB as supervisor and the finance industry which is affected by its decisions."

While the EU Ombudsman's recommendations are non-binding, they do carry a certain amount of weight. The fact that someone with some degree of influence in Brussels' corridors of power has cast a spotlight on the potentially pernicious influence of fora like the Group of 30 on the workings of supposedly independent central banks like the ECB is at least a tentative step in the right direction

venerdì 19 gennaio 2018

The "World's Most Bearish Hedge Fund" Has A "Stunning" Theory What Happens Next To The Dollar

After a rollercoaster year, the clients of Horseman Global, which in 2016 Was dubbed the world's most bearish hedge fund when its net exposure hit over -100%...


... finally got some good news when in his December letter, CIO Russell Clark announced that after returning 5.54% for December, the month emerged back in the green for the full year, up a modest 2.27%.


However, what caught our attention was not the fund's performance, which after a -24% 2016 barely closed in the green in 2017 (and suffered a dramatic plunge in AUM as a result), but Russell Clark's comments on the plunging USD, a topic which seemingly everyone has an opinion on.

Specifically, we found his comments notable because if he is right, the dollar slide will only accelerate, and will have profound consequences not only for assets, but for the US and global economy in the not too distant future.

Here is Clark's "fascinating" - as he puts it - theory about the source of dollar weakness, and more troubling, why what is about to happen next will make the recent collapse in the USD seem like a walk in the park.

Since the financial crisis, I have tried to apply the Japanese Quantitative Easing ('QE') model to the world as more and more central banks moved to zero or negative interest rates and asset purchase programs. In Japan the practical effect of QE has been for Japan to export capital, and this creates credit bubbles in the recipient countries. The country receiving the capital then has to deal with the credit bubble by devaluing and exporting deflation back to Japan. In my view, Japanese QE was the cause of the Asian Financial Crisis, and played a role in the Global Financial Crisis and the Eurocrisis. In Japan QE has meant my strategy has been to always be bullish JGBs, and short Japanese equities whenever they attempt to exit QE, and short the currencies of countries that had accepted QE capital flows. From 2013 to 2016, shorting various emerging markets, and being long developed market bonds was a winning strategy for the Fund.

However, in 2016 Chinese policy changes seemed able to reverse this trend, mainly through government mandated capacity cuts. I have seen many fund managers and economists hold on to investment and economic ideas long after they have been proven wrong, so given this break in the model, I thought it wise to question many of my investment ideas, particularly on bonds.

It is very easy to get bearish on bonds. With Chinese growth improving, and commodity prices rising, inflationary pressure is building. Furthermore, Chinese bonds currently offer 4%, substantially higher than developed market bonds. In addition, in a break with the Japanese experience of QE, the Federal Reserve has managed 5 interest rate increases, rather than only the one or two that Japan has been able to achieve since the bursting of the bubble. The refrain that I have heard these days is that QE works, and the US will be able to easily exit QE policies, followed by the ECB and the BOJ, and that bonds are a sell.

* * *

December tends to be quiet, so I have had time to reflect on market views on QE. Looking at how the US dollar has traded, and the performance of bonds, I am beginning to think that the model is not broken, but needs to be adjusted for the fact that QE is now undertaken by various central banks simultaneously, rather than just by Japan. The big increase in QE from the ECB and the BOJ that we saw in 2016, has seen capital move from Japan and Europe to the US. This has meant that even as the US has raised rates, credit conditions have remained very favourable. This combined with a recovery in China has created an extremely favourable market for all assets in 2017. But what does it mean for 2018?

Well, if the QE model still holds, then the capital flows from Europe and Japan to the US are beginning to slow and even reverse. The implications of this is that the strategy is to be bearish US dollars and bearish on US corporate credit. It also implies being bearish on European and Japanese banks, and buying of bunds and JGBs, however this remains to be seen.

Intriguingly, all these assets are already beginning to move this way. The full implications of thinking this way are fascinating.

And here is the conclusion, where - if Clark is right - better hold on to your hats, because it's about to get very volatile:

The worst-case scenario would be profound dollar weakness forcing the Federal Reserve to increase interest rates much more quickly than expected. Dollar weakness would cause Japanese and European exporters to suffer, forcing money into JGBs and bunds. This would be like the capital flight market in the US we saw in the late '70s. For reference, Swiss bonds yielded only 2% in the late 1970s, even as US rates went to near 20%.

Naturally, it would be poetic justice if the payback for the world's biggest (and really only) globally coordinated episode of QE which injected some $15 trillion in QE in capital markets, was a just as rapid, and accelerating episode of rising interest rates, starting with the US, in the process crushing US stock first and then spreading like a tsunami around the globe.

Maybe mean reversion is not dead after all, maybe it's just waiting for the right reversal to remind the economist PhDs in the Marriner Eccles building that there is no such thing as a free lunch... or free all time highs in the stock market.

And incidentally, for those who are wondering, Horseman "remains long emerging markets, short developed markets."