MARKET FLASH:

"It seems the donkey is laughing, but he instead is braying (l'asino sembra ridere ma in realtà raglia)": si veda sotto "1927-1933: Pompous Prognosticators" per avere la conferma che la storia non si ripete ma fà la rima.


lunedì 15 gennaio 2018

Citi Reveals The Reason Behind The Market's Meltup

It is hardly a secret, that one of the biggest threats facing risk assets in 2018 and onward, is the great central bank QE/balance sheet unwind, something we have discussed extensively in the past year, and as a recent example, in "This Is Most Worrying": In One Year, Central Bank Liquidity Will Collapse From $2 Trillion To Zero," in which Deutsche Bank said that "the most likely causes of a shift to 'flight mode' and a rise in volatility" is that by the end of [2018], the combined expansion of all the major Central Bank balance sheets will have collapsed from a 12 month growth rate of $2 trillion per annum to zero."

This is shown in the following chart depicting the total shrinkage in central bank asset growth:


And yet, despite the Fed's methodical, if slow balance sheet shrinkage and the ECB's recent QE tapering from €60 to €30BN per month, followed by the BOJ's latest "stealth tapering" last week, stocks have started off the new year with a panicked melt-up euphoria the likes of which haven't been seen in decades as the flurry of recent "serious" headlines suggests.

The term of the week is 'melt-up' pic.twitter.com

— Mark Constantine (@vexmark) January 12, 2018

How does one reconcile this historic stock surge at a time of shrinking central bank balance sheets?

The answer comes from Citigroup's credit research team, which points out something most central bank unwind projections have missed, namely that while risk assets on central bank balance sheets may indeed be shrinking, other reserve managers are going in the other direction.

According to Citi's analysts, the answer is that although both the Fed and ECB are scaling back their balance sheets, the increase in EM FX reserves recently, with Chinese FX reserves doing the majority of the heavy lifting, has largely offset all of this. This is highlighted in the left-hand chart below. In fact, as the right-hand chart shows, on a rolling 3 month basis FX reserve purchases by EMs have largely offset all of the implied downward risk impulse from the past year.


As a reminder, last week China reported that its foreign-exchange reserves posted an 11th straight monthly increase, capping a year of recovery amid tighter capital controls, a stronger yuan and resilient economic growth (even if as Goldman calculated much of the reserve increase has been due to valuation effects). At the end of 2017, Chinese reserves climbed by $20.7 billion in December to $3.14 trillion, bringing the full-year increase to $129 billion.


Somewhat coincidentally, the theory that China may be goosing the markets was proposed last week by a different group of Citi analysts, who proposed that "it looks like the PBoC has been adding quite a lot of liquidity in the shorter end of the curve in recent days -with a variety of interbank rates softer, and the 1y CGB yield notably lower by 21bps YTD whereas 5s and 10s yields have stayed broadly flat."

As we said last week, "assuming that Citi is correct, it would explain many things, not least of all the stunning surge higher in Chinese, global and even US stocks." Here is Citi's own "conspiratorial" take:


"Against that background, it is no surprise that equity markets have been so well supported and the SHPROP has exploded upward."

In other words, just like China's aggressive policy change after the Shanghai Accord of February 2016 unleashed a record 21 of 22 positive months for the S&P...


S&P is up 21 of the past 22 months, starting with the Shanghai Accord in Feb 2016 pic.twitter.com

... so it again appears to be China's stealthy asset purchases across global capital markets that has resulted in the market melt-up observed in the end of 2017 and start of 2018.

Of course, in light of recent vocal warnings from China that its Treasury purchases may be discontinued soon, extrapolating China's generous intervention in risk assets for the foreseeable future would be dangerous. Meanwhile, even as Beijing may flip and halt accumulating reserves, one thing is certain - at least for now - that central banks will keep on unwinding their balance sheets. Here's Citi once more:

given that this aggregate central bank liquidity measure has had a significant degree of correlation with risk asset performance over the past few years, we are if anything reaffirmed in our cautious stance on 2018 as a whole. Even if EM FX reserves were to continue accumulating at close to their current rate, that would be outweighed by the almost $1 trillion reduction in DM central bank balance purchases due to occur this year.

Citi's concludes by appropriately wrapping up the balance sheet unwind narrative in the story about the frog - stuck in boiling water - that did not realize how hot the water was until it was too late:

As the old parable goes, a frog that has the misfortune to find itself in a pot of boiling water will generally have the sense to jump straight back out. But if the water is initially tepid and subsequently brought to boil slowly, the frog won't realise what's happening until it's too late.

* * *

The announced trajectories of the major central bank balance sheets indicate that the level of aggregate net asset purchases will reach its 2018 lows in the latter part of the year. But while we may only reach boiling point then, we're already heating up: the delta in tapering is currently very large, with the Fed increasing its pace of net selling and the ECB having halved its net purchase volumes already.

Citi's punchline: "the frog may end up getting cooked well before boiling point." For now, however, the market's daily record highs make a mockery of any warning, and any references to frogs stuck in boiling water are promptly deflected with tantalizing images of massaging bubbles and "nice warm Jacuzzis."

Japanese Purchases Of US Treasurys Tumble

In the last days of 2017, we showed something surprising: as a result of suddenly exploding USDJPY funding costs, there had never been a worse time for Japanese investors, traditionally some of the most ravenous purchasers of US paper, to buy US Treasurys.

As we explained on December 27, USD funding costs for Japanese insurers and banks to invest in US Treasuries - which had surged reaching a post-financial-crisis high of 2.35% on 15 Dec - are determined by three things, namely (1) the difference in US and Japanese risk-free rates (OIS), (2) the difference in US and Japanese interbank risk premiums (Libor-OIS), and (3) basis swaps, which illustrate the imbalance in currency-hedged US and Japanese investments.

In this particular case, widening of (1) as a result of Fed rate hikes and tightening of dollar funding conditions inside the US (2) and outside the US (3) have occurred simultaneously. This is shown in the chart below.


Whatever the cause behind these sharp funding shortages, one thing was clear - dollar funding costs (FX hedging costs) for both Japanese insurers, banks and other investors to buy US Treasuries were surging (with Japanese buyers and reached a post-financial-crisis high of 2.35% on 15 Dec. And in terms of practical implications for the treasury market this means that, all else equal, marginal demand for US paper is about to plunge for one simple reason: the FX-hedged yields on US Treasurys have plunged to (negative) levels never seen before (unless of course foreign investors buy US Treasurys unhedged).

To demonstrate this point, the chart below from Deutsche Bank shows the yields on currency-hedged US Treasuries from the perspective of Japanese investors. Annualized hedge costs had risen to 2.33% at the end of December, which means that investments in 10y US Treasuries would result in virtually no yield. Furthermore, yields from investment in shorter than 10y US Treasuries would be less than JGBs and result in negative spreads.


And while TSY funding costs, and various X-CCY basis swaps in the past two weeks has dropped, Japan's lack of appetite for US Treasurys will only continue to rise.

The reason is that as the Nikkei reports, Japanese investors - traditionally the most enthusiastic foreign buyers of US Treasurys - have become far less enthusiastic about buying US debt last year on growing concern about rising U.S. Treasury yields. According to Ministry of Finance data released on Friday, Japanese investors' net purchases of mid- to long-term foreign bonds tumbled 94.6% on the year to 1.1 trillion yen ($9.9 billion) in 2017, the first annual decline in four years.


In prior years, Japanese institutional investors such as banks and life insurance companies had actively pursued foreign bonds in search of higher returns, finding few alternatives in Japan, where interest rates remained extremely low, and Europe providing few options as a result of the ECB's NIRP policies. As a result, the only option for many was US paper.

But the November 2016 election of Donald Trump as U.S. president sent the 10-year Treasury yield shooting up from around 1.8% to almost 2.6% in just over a month, and the yield stayed above 2% throughout 2017. Any investors holding onto Treasurys during the yield surge would have incurred significant losses as prices tumbled.

Life insurers' net purchases declined 8.4 trillion yen last year, and banks collectively turned into net sellers, with their net sales reaching a record 7.6 trillion yen. Over 2015 and 2016, in contrast, they bought 20.6 trillion yen more than they sold.

In March 2017, Japan's Financial Services Agency announced stricter oversight on foreign bond investment by regional banks. The following month, net sales of mid- to long-term bonds by Japanese investors hit a monthly record of 4.2 trillion yen.

And, of course, as discussed at the top, the higher cost of buying the U.S. dollar is also at play. Life insurers often hedge against a strengthening yen via foreign exchange swaps when investing in foreign bonds. But hedges have become more expensive due to higher U.S. interest rates and other reasons. So the appeal of investing in U.S. bonds has faded overall, unless of course, Japanese investors bid up US paper unhedge, which however could backfire dangerously should FX volatility pick up, or if the dollar continues to devalue against most G-10 peers.

The bottom line: foreign, and certainly Japanese demand for US Treasurys appears to be sliding, whether due to rising yields and P&L losses, or blowing out funding costs, at the worst possible time: just as net supply of US Treasurys is set to double from $488BN in 2017...


... to $1,030BN in 2018, as Goldman calculated last Friday.

Which means that just one hiccup, and yields will soar. It also means that we are one not so major bond tantrum away from the Fed begging preparations for the next massive bond monetization episode, also known as QE4.

A dangerous trade that reminds experts of the 1987 market crash is riskier than ever

· The net position of investment products that track the CBOE Volatility Index — or VIX — has slipped into short territory for just the second time in history.

· Goldman Sachs is worried about what might happen to the market if a spike in volatility ever causes this trade to unwind.

· The situation is arguably more dire than the last time traders were net short, because the stock market has gone that much longer without a major reckoning.

Despite repeated warnings of a painful reckoning, traders can't seem to wean themselves off one of the market's riskiest investment strategies.

The trade in question is the shorting of stock market volatility using exchange-traded products (ETPs), and the situation has reached an extreme only seen once before in history. The net position of ETPs that track the CBOE Volatility Index — or VIX — has become short for just the second time in their eight-year history, according to data compiled by the equity derivatives team at Goldman Sachs.

One possible interpretation of this is that investors are assuming too much risk. But Goldman is more worried about how exposed these positions will be if the VIX spikes unexpectedly — something that could cause traders to quickly reverse positions.

Regardless how you look at it, this is a tenuous situation for markets.

This rarity has accompanied a shift in how volatility is traded. Goldman notes that while VIX ETPs have historically served as hedging tools, they're being increasingly used to make directional short bets. It's a trend that's also caught the eyes of experts across Wall Street.

Perhaps the most outspoken critic of the trade has been Marko Kolanovic, the global head of quantitative and derivatives strategy at JPMorgan — a man so influential that his research reports have moved the market in the past. He said in late July that strategies suppressing price swings reminded him of the conditions leading up to the 1987 stock market crash, and he has since doubled down on the warning on multiple occasions.

More recently, Societe Generale's head of global asset allocation, Alain Bokobza, compared the continued VIX shorting by hedge funds to "dancing on the rim of a voltano." He warned that a "sudden eruption" of volatility could leave traders "badly burned." The comments echoed those made by Bokobza a couple of weeks prior, when he maligned the "dangerous volatility regimes" in the global marketplace.

Even one of the foremost pioneers of modern volatility has gotten in on the criticism — in an interview with Business Insider, the Hebrew University of Jerusalem professor emeritus Dan Galai described the capital being used to short the VIX as "stupid hot money," and he likened the trade to "a substitute for going to Vegas and betting on the roulette."

Worried yet? Fear not, because Goldman has a recommendation that could save you some pain further down the road. The firm says to apply short-dated VIX-based hedges to your portfolio, just in case the dreaded volatility spike does transpire. And in order to do so, a trader should buy February VIX calls — defined as bets the gauge will rise — while selling April VIX calls.

"With the price of VIX tail hedges so unusually high for a low-volatility environment, we prefer paired positions to outright options," Goldman equity derivatives strategist Rocky Fishman wrote in a client note. "Particularly as a volatility spike would likely be short-lived as long as economic and equity fundamentals re
main strong."

‘The Biggest Risk Is A Quick SPX Selloff At The End Of The Day’: It’s Time For A ‘Doom Loop’ Update

Ok, so it's time to talk about VIX ETPs and the "doom loop" again.

Hopefully you don't need a refresher on this, because if you do it likely means you haven't been paying much attention to how shifts in market structure are creating systemic risks that no one understands, but just in case, the idea is that thanks to the low starting point on the VIX, a nominally small spike could force inverse and levered VIX ETPs to panic buy VIX futs into said spike, thus exacerbating the situation and ultimately forcing CTAs, vol. control funds, and risk parity to deleverage into a falling market.


This is either very scary or not a big deal depending on the predisposition of the person you're asking. One person who has been tracking this for quite sometime is Goldman's Rocky Fishman. Rocky was at Deutsche until mid-2017 and upon jumping ship to the Squid, he picked up right where he left off. On Thursday, he's out with a new piece on VIX ETP rebalance risk, but before he gets to that, he notes something anomalous. 

"The net position of VIX ETPs has become short over the past few weeks, for only the second time in their eight year history," Fishman begins, before explaining that "the shift toward negative net vega has happened for passive reasons: the shares' strong performance (XIV up 185% in 2017) has left each share of the XIV and SVXY with 50% more VIX futures exposure than it had three months ago, offsetting net outflows from the products."


While that, in and of itself, isn't necessarily something to be overly concerned about, Fishman notes that "the size of inverse and levered ETPs in the aggregate is important and the growth of inverse VIX ETP products is worrisome [because] although small in the context of the broader US equity market (VIX ETPs have around $5bln total AUM), ETPs are large in the context of the VIX derivatives market."

There's a very interesting discussion in the note that finds Fishman breaking down CFTC positioning, but in the interest of brevity, we'll cut to the above-mentioned "doom loop" dynamic. The bottom line is this:

The most important takeaway of the net short VIX ETP position is that short VIX ETPs now have more vega to buy on a given vol spike than ever before – leaving the potential for an outsized increase in volatility should the SPX sell off sharply.

Just a 3-point spike in VIX futures (so, from the current weighted average of 11.5 to 14.5) would force VIX ETP issuers to buy $110mm vega. That, Fishman says with some alarm, is "double the highest ever seen before 2017" and represents "~60% of daily 1st/2nd VIX futures volume, and around 30% of open interest."


If that were to materialize and the rebalance were to exacerbate the vol. spike, well then Marko Kolanovic's "quantitative exuberance" comes into play. Recall this from Marko's year-ahead outlook:


We think that for the next market crisis, irrational exuberance in the 'tech bubble' sense is not needed. The reason is the prevalence of quantitative and passive strategies that don't decide based on emotions, but rather based on measures such as the level of interest rates, volatility, price momentum, or bond-equity correlation. Examples of these strategies include Volatility Targeting, Low Volatility strategies, Trend Following strategies, Risk Parity strategies, Dynamical hedging strategies, Volatility selling strategies, and others. In addition, there are relative value strategies that transmit risk premia compression across asset classes and strategies. With volatility at record lows and central bank balance sheet inflows peaking this year, these strategies currently experience 'quantitative exuberance' that poses risk when monetary policies start normalizing in a meaningful way next year.

Right. Bloomberg's Tommi Utoslahti was out underscoring this overnight. "Sustained lower volatility enables traders and hedge funds to take more leverage for the same value-at-risk (VAR) score," Utoslahti wrote, adding that "the longer markets stay calm, the more vulnerable they become to a sudden shock causing an outsized deleveraging event."

Fishman reminds you that the biggest risk is an "a quick SPX selloff near the end of a trading day, pushing issuers to rebalance positions quickly to avoid unhedged overnight risk (ETN issuers) or excessive tracking error (ETF issuers)."

What could cause this, you ask?

Well, as far as the quick selloff at the end of the day goes, think: Mueller, North Korea and/or Trump with Trump being the common denominator.

But more generally, an uptick in inflation that catches central banks behind the curve and brings out the hawks could be what tips the first domino on a bond tantrum.

Or, something out of left field – like say the "fake news" that China is halting purchases of U.S. Treasurys.

Unlikely? Of course. Possible? Also of course. And once the ball gets rolling, it will be hard to stop the self-feeding nightmare.

domenica 14 gennaio 2018

A worrysome Chart: HY Bond A-D Line


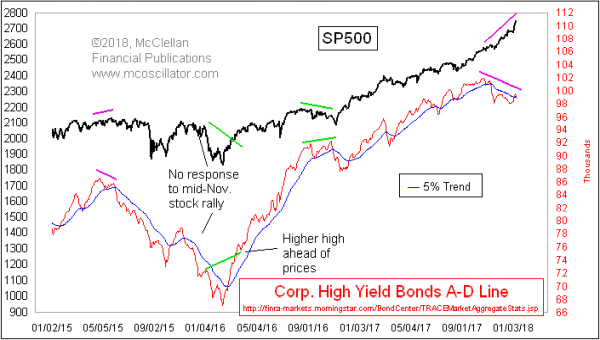
There is no divergence yet between stock indices and the NYSE's composite A-D Line. But there is one in the High Yield Bonds A-D Line, and that is an early warning of big trouble to come.

High yield bonds usually trade more like stocks than like T-Bonds, and so that has led a lot of analysts to keep an eye on junk bond ETFs like HYG and JNK, especially if they show a divergence relative to stock price indices. Those ETFs tend to be dominated by high yield bonds that are related to oil exploration, and so the price of crude oil can move them around a bit.

The High Yield Bond A-D Line is more egalitarian, looking at the behavior of all of the high yield corporate bonds as tracked by FINRA. Each one gets an equal vote, which is why looking at A-D Lines can be useful in giving a different message than cap-weighted price indicators. And the High Yield Bonds A-D Line in particular can give us interesting indications early on that liquidity is starting to dry up.

High yield bonds are very risky, and thus they tend to be more sensitive to changes in financial market liquidity. We saw an example of this in 2015, when this A-D Line peaked in April 2015, well ahead of the ugliness for the SP500 which arrived later that year and in early 2016. Liquidity seemed to have been restored just after that February 2016 price bottom, and the High Yield Bonds A-D Line shot higher to demonstrate that refreshed liquidity condition. 


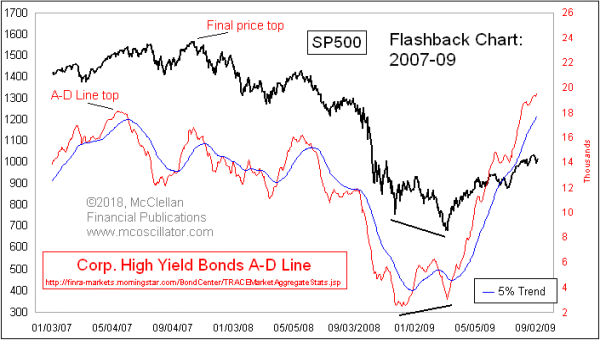
2007 gives us another example of this principle:


The SP500 had its final price top in October 2007, and we had warning of that from the NYSE A-D Line which had peaked in June 2007. But the High Yield Bonds A-D Line peaked all the way back in May 2007, giving even earlier warning that liquidity was starting to be a problem.

Just because we have a divergence warning now does not mean that the stock market has to start downward right away. It can take a few months before stock traders start to realize that liquidity is getting tight. And it is also possible that a sudden gush of liquidity could lift the high yield bond market, taking away this apparent divergence. I do not think that is going to happen, but it is possible.

This warning from the High Yield Bonds A-D Line fits well with my expectation of a significant stock market in the first 2018 quarter (if delayed, March? Possibly earlier). That expectation comes from my eurodollar COT leading indication. 

Crude Oil Commercials at Record Short Exposure

On April 10, 2017 I penned a piece called Taking A Look at Silver where I wrote: "When watching COT levels each week, what is important to me is the trend in the positions that Commercials and Large Specs hold. But what is also important to me is when extreme positions occur." 

A week later, as the chart below shows, silver peaked at $18.65 and started a slide that took prices to $14.34 at the low in early July.


Figure 1: Silver Continuous Contract

This reaffirmed my belief that it is important to pay close attention to COT data, especially when it is making new 52-week or all-time record readings. Today, crude oil COT data is at an extreme, meaning it is time to pay attention.

The chart below shows that Commercials are at a new 52-week-high in the number of net short futures contracts they hold, while Large Speculators (aka managed money and hedge funds) are at a 52-week-high in the number of long contracts they hold.


Figure 2: Crude Oil Net Commitments of Futures Traders

Commercials, often referred to as the 'smart money,' are hedgers that deal with the underlying commodity as part of doing business. Commercials are large operators with very deep pockets, and they are exempt from position limits and are allowed to post smaller margins (i.e., they are able to use more leverage). It's important to note that this snapshot of commercial positions is as of the close Tuesday, January 2, 2018 and are reported by the CFTC on Friday afternoon of the same week.

When watching COT levels each week, what is important to me is the trend in the positions that Commercials and Large Specs hold. However, what is also important to me is when extreme positions occur. Looking at the chart below we see commercial positions back to 1993, and what jumps out at me is the fact that the current commercial short position of 1,414,461 short contracts is a record short position.


Figure 3: Crude Oil Hedgers Position

The weekly price chart below shows that $WTIC has rallied nicely from its early January 2016 low, and is sitting at the 2015 high.

Figure 4: Light Crude Oil Continuous Contract

The bottom line is that investors are excessively optimistic while Commercials are at a record level of bearishness. 

The price chart (Figure 5) has a couple of divergences (RSI, MACD, volume) and might be set up for a decline, or correction at a minimum. What is unknowable is whether a pullback will be short and shallow or long and deep. 


Figure 5: Crude Oil Continuous Contract

Is This The Long-Awaited Gold Break-Out – Or Just Another Paper Market Head Fake?


That was fun. Since mid-December gold has behaved like a tech stock, jumping from $1,240/oz to $1,337 and carrying a long list of gold mining stocks along for the ride.

Now everybody's asking the same question: Is this finally the start of the long-overdue run at gold's (and silver's) 2011 record high, or just a case of futures speculators once again panic-buying themselves into an untenable long position, only to be fleeced by the big banks that dominate the paper markets?

The commitment of traders (COT) report is not encouraging. In the current rally, the speculators (who are, remember, usually wrong at big turning points) have jumped back in with both feet and are now enthusiastically long while the commercials (usually right at big turning points) are once again aggressively short.

The next chart shows this visually. When the two columns converge, that's bullish for gold. When they diverge that's bearish. Favorable conditions of early December have quickly morphed back to bearish.

Looking at just this one indicator, it would be reasonable to assume that gold's all-too-brief run is about to end. But on the other side of this equation is the certainty that physical demand will eventually swamp these paper games and send gold and silver up in a bitcoin-worthy arc to their intrinsic values of $5,000/oz and $100/oz, respectively.

Therein lies the gold-bug's dilemma. Precious metals will bounce around aimlessly – until they don't – but the phase change won't be obvious until after the fact. With that in mind, here are three possible approaches:

  • Avoid this asset class until a sustained uptrend is clearly established. That means waiting for, say, $1,500/oz before jumping in. So you give up a few hundred dollars an ounce in return for avoiding the pointless back-and-forth, but in the end still triple your money. Not bad. 
  • Keep adding a little at a time. Each month buy a few silver coins or a few more gold mining shares and tune out the noise (such as this article), safe in the knowledge that eventually the dysfunctional global monetary system will come undone and capital will pour into the relative handful of safe haven assets like gold and silver, making the highs and lows of the before-times completely irrelevant. This is the best way to deal with incomplete knowledge of the future, and is therefore what most people should do.
  • Assume that this is it — that the current uptrend will soon go parabolic — and jump into precious metals with both feet. If it works, it's one of those life-changing bets that everyone wishes they had the guts to make. If not, well, at least the downside is limited at this point.

The longer this goes on, the more attractive the third option becomes.

Party While You Can: The Central Banks Are Ready To Pop The ‘Everything Bubble’.


Many people do not realize that America is not only entering a new year, but within the next month we will also be entering a new economic era. In early February, Janet Yellen is set to leave the Federal Reserve and be replaced by the new Fed chair nominee, Jerome Powell. Now, to be clear, the Fed chair along with the bank governors do not set central bank policy. Policy for most central banks around the world is dictated in Switzerland by the Bank for International Settlements. Fed chairmen like Janet Yellen are mere mascots implementing policy initiatives as ordered.  This is why we are now seeing supposedly separate central banking institutions around the world acting in unison, first with stimulus, then with fiscal tightening.

However, it is important to note that each new Fed chair does tend to signal a new shift in action for the central bank. For example, Alan Greenspan oversaw the low interest rate easy money phase of the Fed, which created the conditions for the derivatives and credit bubble and subsequent crash in 2008. Ben Bernanke oversaw the stimulus and bailout phase, flooding the markets with massive amounts of fiat and engineering an even larger bubble in stocks, bonds and just about every other asset except perhaps some select commodities. Janet Yellen managed the tapering phase, in which stimulus has been carefully and systematically diminished while still maintaining delusional stock market euphoria.

Now comes the era of Jerome Powell, who will oversee the last stages of fiscal tightening, the reduction of the Fed balance sheet, faster rate increases and the final implosion of the 'everything' bubble.

As I warned before Trump won the election in 2016, a Trump presidency would inevitably be followed by economic crisis, and this would be facilitated by the Federal Reserve pulling the plug on fiat life support measures which kept the illusion of recovery going for the past several years. It is important to note that the mainstream media is consistently referring to Jerome Powell as "Trump's candidate" for the Fed, or "Trump's pick" (as if the president really has much of a choice in the roster of candidates for the Fed chair). The public is being subtly conditioned to view Powell as if he is an extension of the Trump administration.

This could not be further from the truth. Powell and the Fed are autonomous from government. As Alan Greenspan openly admitted years ago, the Fed does not answer to the government and can act independently without oversight. So, why is the media insisting on misrepresenting Powell as some kind of Trump agent? Because Trump, and by extension all the conservatives that support him, are meant to take the blame when the 'everything' bubble vaporizes our financial structure. Jerome Powell is "Trump's guy" at the Fed; so any actions Powell takes to crush the recovery narrative will also be blamed on the Trump administration.

But, is it a certainty that Powell will put the final nail in the coffin of "economic recovery?" Yes. Last Friday the Fed finally released the transcripts of its monetary policy meetings in 2012, and in those transcripts are some interesting admissions from Powell himself. After reading these transcripts I am fully convinced that Powell is the man who will stand as the figurehead of the central bank during the final phase of U.S. decline.

Here are some of the most astonishing quotes by Powell from those transcripts along with my commentary. These quotes are yet another piece of evidence that vindicates my position on the Fed as an economic saboteur and my position on the historic market bubble the bank has created:

Powell: "I have concerns about more purchases. As others have pointed out, the dealer community is now assuming close to a $4 trillion balance sheet and purchases through the first quarter of 2014. I admit that is a much stronger reaction than I anticipated, and I am uncomfortable with it for a couple of reasons.

First, the question, why stop at $4 trillion? The market in most cases will cheer us for doing more. It will never be enough for the market. Our models will always tell us that we are helping the economy, and I will probably always feel that those benefits are overestimated. And we will be able to tell ourselves that market function is not impaired and that inflation expectations are under control. What is to stop us, other than much faster economic growth, which it is probably not in our power to produce?"

Assessment: By all indications the Fed did do more, MUCH more. Including QE3, various stimulus packages and incessantly low interest rates for years, the Fed has essentially stepped in every time stock markets in particular were about to crash back to their natural state of decline. Powell is being rather honest in his estimation here that these stopgaps are in fact temporary and that the Fed cannot produce true economic growth to support the market optimism they have created through their interventions. He is stating openly that markets will only remain optimistic so long as they are assured that the Fed will continue to intervene.

This is probably why it took almost six years before these transcripts were released.

Powell: "When it is time for us to sell, or even to stop buying, the response could be quite strong; there is every reason to expect a strong response. So there are a couple of ways to look at it. It is about $1.2 trillion in sales; you take 60 months, you get about $20 billion a month. That is a very doable thing, it sounds like, in a market where the norm by the middle of next year is $80 billion a month. Another way to look at it, though, is that it's not so much the sale, the duration; it's also unloading our short volatility position."

Assessment: And here we have Powell's shocking admission, clarifying his previous point — the "strong response" that Powell is referring to is a market reversal, or bubble implosion. He even admits the existence of the Fed's "short position on volatility." This explains the strange behavior of the VIX index, which has plunged to record lows as "someone" continually shorts VIX stocks in order to interfere with any decline in markets.

This interference in the VIX has conjured an aberration, a market calm and investor confidence that is artificial. Such overconfidence, when optimism turns into mania, has happened before. In fact, the end of the Greenspan era was awash in such exuberance. And this delusion always ends the same way — with crisis.

I would also like to mention here that I have seen some disinformation being planted on Powell's statements in 2012, asserting that he was "not talking about stock markets" specifically. Obviously he is, as you will see in other parts of his statement, but to reinforce the point, here is a quote from another Fed member who spilled the beans, Richard Fisher:

"What the Fed did — and I was part of that group — is we front-loaded a tremendous market rally, starting in 2009.

It's sort of what I call the "reverse Whimpy factor" — give me two hamburgers today for one tomorrow."

Fisher went on to hint at his very reserved view of the impending danger:

"I was warning my colleagues, Don't go wobbly if we have a 10 to 20 percent correction at some point… Everybody you talk to… has been warning that these markets are heavily priced." [In reference to interest rate hikes]

So, what happens when the Fed stops shorting volatility and ends the easy money being pumped into markets? Well, again, I think Powell and Fisher have just told you what will happen, but let's continue.

Powell: "My third concern — and others have touched on it as well — is the problems of exiting from a near $4 trillion balance sheet. We've got a set of principles from June 2011 and have done some work since then, but it just seems to me that we seem to be way too confident that exit can be managed smoothly. Markets can be much more dynamic than we appear to think.

When you turn and say to the market, "I've got $1.2 trillion of these things," it's not just $20 billion a month — it's the sight of the whole thing coming. And I think there is a pretty good chance that you could have quite a dynamic response in the market."

Assessment: The Fed balance sheet is being reduced NOW, and Powell as chairman will only continue the process if not expedite it. Some people may argue that Powell is displaying an attitude that would suggest he is not on board with tightening policies. I disagree. I believe Powell will make the argument that the band-aid must be ripped off and that stock markets need some "tough love".

In fact, Fed members including Yellen and former member Alan Greenspan (is there such a thing as a "former" member of the Fed?) have already been fielding the notion that stock markets are suffering from "irrational exuberance" and that something must be done to "temper inflation."

Powell is also acknowledging the mass-psychological aspect of investors, now trained like Pavlovian dogs to salivate over stock tickers instead of thinking critically on the implications of equities that "can't lose".  When they finally begin to realize that equities can indeed lose, and that the Fed is going to let them lose, what will the result be, I wonder?

Powell: "I think we are actually at a point of encouraging risk-taking, and that should give us pause. Investors really do understand now that we will be there to prevent serious losses. It is not that it is easy for them to make money but that they have every incentive to take more risk, and they are doing so. Meanwhile, we look like we are blowing a fixed-income duration bubble right across the credit spectrum that will result in big losses when rates come up down the road. You can almost say that that is our strategy."

Assessment: Wow! And there you have it. The new Fed chair's own prognostications. He even used the dreaded "B" word  bubble. Yes, as I have been arguing for quite some time, the Fed will continue to raise rates and cut off the low cost money supply to banks and corporations that has helped boost stock markets as well as numerous other asset classes.  And now we discover after six years a Fed official, soon to be the Fed chairman, telling you EXACTLY what is about to happen within American markets, reinforcing my long held position.

Powell even mentions that "this is their strategy." Now, that could be interpreted a few ways, but I continue to hold that the Fed plans to deliberately crash markets and that this will be a controlled demolition of the U.S. economy.

Trump may actually clash with Powell over these measures in the near future, considering Trump has thoroughly taken credit for the insane stock market rally that has dominated since his election. But, this will only add to the fake drama. Imagine, the very man Trump "picked" as the new head of the Federal Reserve undermining the market bubble which Trump boasts about on his Twitter account. The Kabuki theater will be phenomenal.

All the while, the true culprits behind the bubble and the crash, the international financiers and banks, will escape almost all scrutiny as the public mindlessly follows the political soap opera played out in the mainstream media.

Markets Still Blow Off the Fed, Dudley Gets Nervous, Fires Warning Shot.


In search of the elusive soft landing.

"So, what am I worried about?" New York Fed President William Dudley, who is considered a dove, asked rhetorically during a speech on Thursday at the Securities Industry and Financial Markets Association in New York City. "Two macroeconomic concerns warrant mention," he continued. And they are:

One: "The risk of economic overheating." He went through some of the mixed data points, including "low" inflation, "an economy that is growing at an above-trend pace," a labor market that is "already quite tight," and the "extra boost in 2018 and 2019 from the recently enacted tax legislation."

Two: The markets are blowing off the Fed. He didn't use those words. He used Fed-speak: "Even though the FOMC has raised its target range for the federal funds rate by 125 basis points over the past two years, financial conditions today are easier than when we started to remove monetary policy accommodation."

When the Fed raises rates, its explicit intention is to tighten "financial conditions," meaning that borrowing gets a little harder and more costly at all levels, that investors and banks become more risk-averse and circumspect, and that borrowers become more prudent or at least less reckless – in other words, that the credit bonanza cools off and gets back to some sort of normal.

To get there, the Fed wants to see declining bond prices and therefor rising yields, cooling equities, rising risk premiums, widening yield spreads, and the like. These together make up the "financial conditions."

There are various methods to measure whether "financial conditions" are getting "easier" or tighter. Among them is the weekly St. Louis Fed Financial Stress Index, whose latest results were published on Thursday.

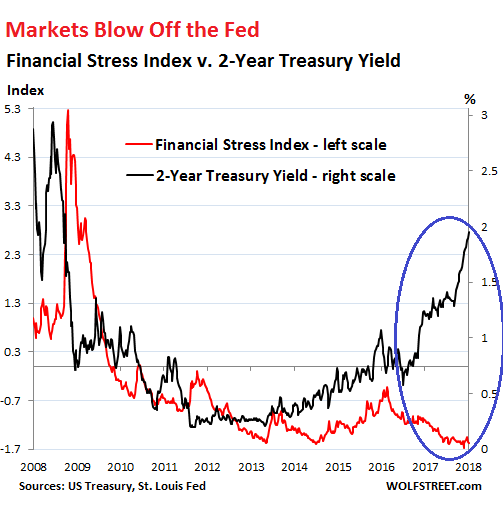
The Financial Stress Index had dropped to a historic low of -1.6 on November 3, meaning that financial stress in the markets had never been this low in the data series going back to 1994. Things were really loosey-goosey. On Thursday, the index came in at -1.57, barely above the record low, despite another rate hike and the Fed's "balance-sheet normalization.

And this rock-bottom financial stress in the markets is occurring even as short-term interest rates have rocketed higher in response to the Fed's rate hikes, with the two-year Treasury yield on Thursday closing at 1.96% for the third day in a row, the highest since September 2008.

The two-year yield and the Financial Stress Index normally move more or less in parallel. But in July 2016, when it became clearer that the Fed would finally stop flip-flopping and start raising rates, the two-year yield began to rise sharply and recently began to spike. But the Financial Street Index fell.

This chart of the St. Louis Fed's Financial Stress Index (red, left scale) and the two-year Treasury yield (black, right scale) shows this gaping crocodile-jaw disconnect:

The Financial Stress Index is made up of 18 components. A value of zero represents "normal" financial market conditions. Values below zero indicate below-average financial market stress. Values above zero indicate higher than average stress.

So with the economy facing the risk of "overheating," and with markets doing the opposite of what the Fed wants them to do – namely cooling off – Dudley warned:

This suggests that the Federal Reserve may have to press harder on the brakes at some point over the next few years. If that happens, the risk of a hard landing will increase. Historically, the Federal Reserve has found it difficult to achieve a soft landing – especially when the unemployment rate has fallen below the rate consistent with stable inflation.

In those circumstances, the Federal Reserve has been unable to both push up the unemployment rate slightly to a level that is consistent with stable inflation and avoid recession.

It was a shot before the bow – one of many – for the markets to start paying attention to the Fed. Monetary policies have no impact unless markets believe in them, react to them, and thus effectively implement them. But this might be a lot to ask, after the Fed has spent years methodically and thoroughly destroying its own credibility by flip-flopping wildly at every market squiggle, first on tapering QE while it was still going on and then on raising rates.

Eventually markets fall in line. And if I read Dudley's words correctly, he is worried that markets will fall in line too late, and only after the Fed has fired some big guns to get their attention, and then it might happen all at once, and the sudden adjustment in prices, yields, spreads, risk premiums, etc. might be too brutal for the economy to digest.

At taxpayer expense, the easiest, risk-free, sit-on-your-ass profit ever.

Fed Pays Banks $30 Billion for 2017


At taxpayer expense: easiest, risk-free, sit-on-your-ass profit ever.

The Federal Reserve's income from operations in 2017 dropped by $11.7 billion to $80.7 billion, the Fed announced last week. Its $4.45-trillion of assets – including $2.45 trillion of US Treasury securities and $1.76 trillion of mortgage-backed securities that it acquired during years of QE – produce a lot of interest income.

How much interest income? $113.6 billion.

It also made $1.9 billion in foreign currency gains, resulting "from the daily revaluation of foreign currency denominated investments at current exchange rates."

For a total income of about $115.5 billion.

Those are just "estimates," the Fed said. Final "audited" results of the Federal Reserve Banks are due in March. This "audit" is of course the annual financial audit executed by KPMG that the Fed hires to do this. It's not the kind of audit that some members in Congress have been clamoring for – an audit that would try to find out what actually is going on at the Fed. No, this is just a financial audit.

As the Fed points out in its 2016 audited "Combined Financial Statements," the audit attempts to make sure that the accounting is in conformity with the accounting principles in the Financial Accounting Manual for Federal Reserve Banks. Given that the Fed prints its own money to invest or manipulate markets with – which makes for some crazy accounting issues – the Generally Accepted Accounting Principles (GAAP) that apply to US businesses to do not apply to the Fed.

This annual audit by KPMG reveals nothingexcept that the Fed's accounting is in conformity with the Fed's own accounting manual.

Here is what the banks Get:

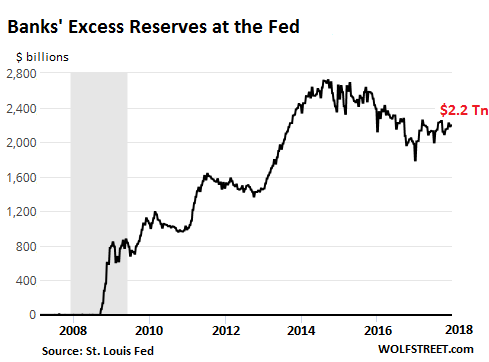
The Fed pays the banks interest on their "Required Reserves" and on their "Excess Reserves" at the Fed. Excess Reserves are the biggie: As a result of QE, they jumped from $1.7 billion in July 2008, to $2.7 trillion at the peak in September 2014. They've since dwindled, if that's the right word, to $2.2 trillion:

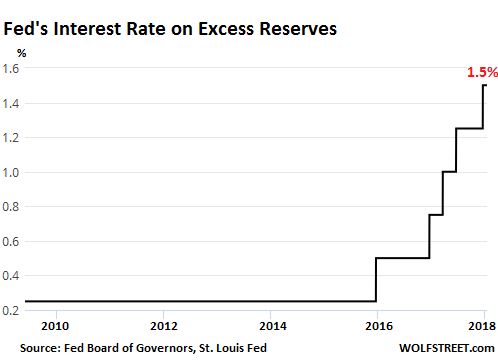
When the Federal Open Markets Committee (FOMC) meets to hash out its monetary policy, it also considers what to do with the interest rates that it pays the banks on "Required Reserves" and on "Excess Reserves." In this cycle so far, every time the Fed has raised its target range for the federal funds rate (now between 1.25% and 1.50%) it also raised the interest rates it pays the banks on "required reserves" and on "excess reserves," which went from 0.25% since the Financial Crisis to 1.5% now:

So the amount of excess reserves has fallen since 2014. But the interest rate that the Fed pays on them has been ratcheted up since December 2015. And so has the amount that the Fed pays the banks. In 2017, a year with three rate hikes, the interest that the Fed paid the US banks and foreign banks doing business in the US jumped by $13.8 billion to $25.9 billion.

That $25.9 billion is the easiest, most risk-free, sit-on-your-ass profit that banks ever made in the history of mankind. More on that in a moment – particularly out of whose pocket this comes.

The Fed also paid banks $3.4 billion in interest on securities sold under agreement to repurchase.

What else needs to be taken care of?

The 12 Federal Reserve Banks cover their own operating expenses of $4.1 billion. Plus, there are these items, among others:

  • $724 million for the costs related to producing, issuing, and retiring currency.
  • $740 million for expenses associated with the Fed's Board of Governors.
  • $573 million to fund the operations of the Consumer Financial Protection Bureau

Oh, and the dividend…

The Fed paid $784 million in statutory dividends to the financial institutions that own the 12 Federal Reserve Banks.

US Treasury gets most of the rest.

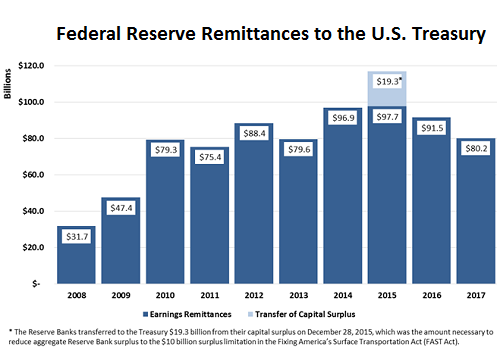
After everything has been taken care of, the Fed had a net income of $80.7 billion, which is tax free, of which it remits an estimated $80.2 billion to the Treasury:

In the chart, note how the surging interest payments to the banks slashed into the remittances to the Treasury. If the Fed hadn't decided to pay interest on excess reserves, to benefit the banks, it could remit this money to the Treasury. In other words, every dime the banks receive comes indirectly out of the pocket of taxpayers.

The Fed will likely raise rates further this year. There is talk of four rate hikes. This would push the rate on excess reserves to 2.5% by the end of the year. Excess reserves will likely shrink as QE is being unwound, but not fast enough. And the amount that the Fed pays the banks this year might surge to $40 billion or more — a glorious and hidden subsidy extracted from taxpayer pockets.

At the same time, the Fed is shedding its income-producing assets as it unwinds QE and will make less income in 2018 than in 2017. With less money coming in, and paying more to the banks, the amounts remitted to Treasury and therefore the taxpayer will likely plunge. But at least megabank CEOs will be happy. Ka-ching.

First decline in the Bank of Japan's colossal balance sheet since 2012!