venerdì 20 luglio 2018

China is Now Officially at War With the US and Japan

It is not a war of guns and soldiers, but a war of finance.

The Trump White House is aggressively going after China on trade. Every other month we are seeing a new round of tariffs announced on hundreds of billions of dollars' worth of Chinese exports.

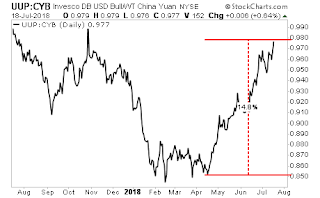
China is retaliating by devaluing the Yuan against the US Dollar at a pace not seen since early 2016. In real terms, the 10% in tariffs the Trump administration will implement on Chinese goods has ALREADY been negated by China's 14% Yuan devaluation.

A 10% tariff won't add up to much when China's currency is nearly 15% cheap relative to the US Dollar.


There is a second component here… China is well aware that President Trump takes GREAT pride in the fact US stocks have rallied since his election in 2016. With that in mind the Yuan devaluation can be seen as a direct attack on US stocks: the last two times the Yuan was devalued at this pace, the S&P 500 dropped 11% and 12% respectively.


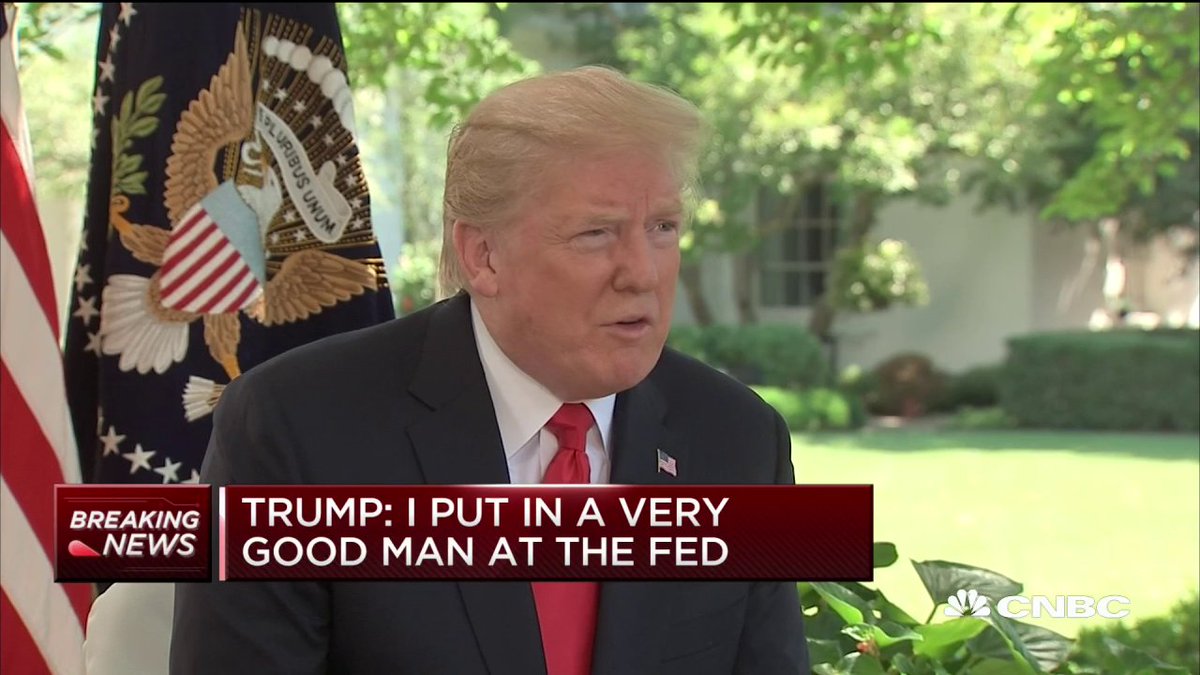
So who does President Trump call to defend the S&P 500?


Tech Alert: "Warning Signs Are Very Pronounced"

The $NDX keeps moving from new highs to new highs driven by a narrow group of stocks. Nothing new about that as this trend has been ongoing for some time and headlines of new record prices for such stocks such as $FB, $AMZN, $GOOGL, $MSFT are now a daily occurrence. The untouchables. Jeff Bezos is worth $140B, no that was so last week, now he's worth $150B.

How do you quantify risk in a market that prices in no risk?

While most people are focused on stocks prices one underlying issue that appears to be largely ignored by participants is the unprecedented market capitalization expansion we are witnessing in these few select stocks.

The numbers are simply staggering. Magic money out of thin air.

$FB, $GOOGL, $AMZN, $MSFT and $AAPL. These 5 stocks now worth nearly $4.1 trillion. That makes these 5 companies the 4th largest economy of the world if you use GDP as a reference. Not bad for less than a million people employed at these 5 companies.

Now check this out: Their combined market cap increase? $260,000,000,000. That's $260B. In just the past ELEVEN trading DAYS!

No seriously:

Oh it gets better.

2018 year to date? EIGHT HUNDRED TWELVE BILLION DOLLARS market cap expansion in just 6.5 months. $812,000,000,000. That's a company the size of a $MSFT or $GOOGL in its own right.

Now all these companies are growing revenues and earnings, but have they have expanded revenues, never mind earnings, in the past 6.5 months that justify an $812B increase in market cap? Buyers at these levels must think so.

Now let's put this market expansion in context of charts.

$MSFT yearly:

$MSFT is now 29% above its yearly Bollinger band and 42% above its yearly 5EMA. Its touched its yearly 5 EMA every year since inception except 2000.

$AMZN:

$AMZN is now 49% above its yearly Bollinger band and 67% above its yearly 5EMA.

Doesn't matter whether you show linear or log charts, the percentages are the same, but the linear charts highlight the historic perspective.

This is the kind of price expansion and technical disconnect that reminds of $CSCO in 2000:

$NDX is now on its 10th uninterrupted year up:

17% above its yearly Bollinger band and 31% above its yearly 5 EMA.

My premise remains: Eventual technical reconnects are coming with all of these and this defines the correction risk in this market. As the larger indices are now very much dependent on its largest market cap components continuing to ascent.

And for now this trend continues.

$NDX made another all time human history high yesterday also far disconnected from its quarterly 5 EMA again:

And it's all about the magic 5 as the larger Nasdaq continues to show lower highs for new highs vs new lows as $NDX keeps marching on to new highs:

Yesterday 4 of the fab 5 had outside reversal days on the gap down and registered all time highs on negative divergences:

And of course $NDX also had negative divergence on multiple time frames from short to long:

On the 2 hour chart:

On the monthly chart:

I could go on, but you get my drift.

Massively extended charts with extreme market cap appreciations concentrated in a handful of stocks.

Are investors concerned?

It does not appear so as the $VIX has retreated back to below 12 yesterday and today, ironically retesting the broken trend line again:

I submit the combination of the factors above suggest that investors are greatly under appreciating risk in tech, hence the tech alert here. $812B in market cap appreciation came in 5 stocks in just 6.5 months. History suggests that vastly extended charts making new highs on negative divergences at points of extreme low volatility are subject to risk reversion and large market appreciations can disappear more quickly than investors are usually prepared for.

Fro now they keep on chugging along and perhaps will make further highs. But the warning signs are very pronounced.

If Everything's So Awesome, Why Are Investors Paying So Much For Crash Protection?

Tech stocks soaring to record highs and a slump in volatility suggest investors are brushing aside market risks, trade war concerns, and Central Bank tightening.

However, as Bloomberg notes, there is at least one gauge of investor sentiment that hints at a growing concern. The Cboe Skew Index, which tracks the cost of tail-risk equity protection, has jumped to the highest level since October. The rise signals options traders are growing wary of wild swings, just as the International Monetary Fund warned financial markets seem complacent to mounting risks in the global economy.

Generally, a rise in skew indicates that 'crash protection' is in demand among institutional investors(institutional/professional investors are the biggest traders in SPX options).

But an unusual move in the skew index (which historically has tended to oscillate approximately between a value of 100 and 150) is especially interesting when it diverges strongly from the VIX, which measures at the money and close to the money front month SPX option premiums.

Basically what a 'low VIX/high skew' combination is saying is: 'the market overall is complacent, but big investors perceive far more tail risk than usually' (it is exactly the other way around when the VIX is high and SKEW is low). Below is a chart showing the current SKEW/VIX combination...back to the same level it was at before the short-vol collapse accelerated in Jan/Feb.

In other words, a surprising increase in realized volatility may not be too far away.

Perhaps this is one reason why - based on the uncertainty of economic policy, VIX should be trading north of 40...

But it's not just equity crash risk that is bid, credit investors are piling into CDS markets, worried there won't be enough liquidity in a downturn - taking steps to avoid getting stuck with hard-to-trade corporate bonds.

As Bloomberg reports,  volume on Markit's CDX North American Investment Grade Index, which tracks default swaps on 125 high-grade corporate bonds, reached a new milestone in the first half of 2018 of $1.56 trillion. That eclipsed every previous period in the past five years of data available.

An abrupt surge in turnover in such derivatives typically coincides with periods of turmoil as investors rush to hedge credit risk.

"Investors are putting more allocations into more-liquid portfolio products so they can be more nimble in a downturn," said Anindya Basu, head of U.S. credit derivatives strategy at Citigroup Inc. "When markets were rallying, people thought about liquidity, but it may not necessarily have been on the top of their agenda."

And since the February vol complex debacle, credit risk has remained dramatically elevated...

As heightened concerns about an escalating trade war and the prospect of tighter monetary policy are overshadowing the otherwise healthy economic backdrop for high-grade corporate credit.

"When markets gets really stressed, cash tends to underperform," Basu said. "Investors are starting to get more bearish than a year ago; they're worried about a variety of risks such as rising rates and trade wars."

Leaving us wondering, if everything's so awesome? Stocks soaring (well FANGs soaring), GDP expectations soaring, confidence soaring, why is the yield curve collapsing and why are professional investors scrambling to buy protection against a crash in equity and/or credit markets.

Central Banks Are Using The Trade War To Hide Their Direct Influence On Stocks

There has been a lot of confusion lately in the mainstream economic media as well as in independent media circles as to the behavior of stock markets in the wake of the recently initiated global trade war. In particular, stocks suffered one of the longest runs of negative days in their history in June, only to then spike just after Donald Trump "officially" began trade war tariffs in July. The expectation by many was that the headlines would cause an immediate and continued downturn in equities markets, but this was not the case. Many analysts have been left bewildered.

This is an issue I have touched on multiple times since the beginning of this year, and it is something I predicted long before Trump's election in 2016. But it is obvious that the schizophrenic nature of stocks needs to be addressed in a very concise, no-holds-barred fashion, because there are still far too many people who are looking at all the wrong causes and correlations.

First, let's be clear: stock markets are NOT tracking the news headlines. The past month should have proved this if there was any previous doubt.

It is hard for investors and some analysts to grasp this fact, primarily because for at least the past few years it appeared as though stock markets were utterly dictated by headlines out of Bloomberg, Reuters and other mainstream media outlets. Once investors and analysts became used to this narrative it was difficult for them to adapt when the dynamic changed. They are still living in the past based on an assumption that was never quite correct to begin with.

In reality, headlines never actually dictated stock prices; it was always the Federal Reserve among other central banks.

As I and others have noted consistently, stock market valuations for the past several years have tracked almost perfectly with the Fed's balance sheet. That is to say, every time the Fed purchased more assets and increased the balance sheet, stocks went up.

After years of the notorious "Fed Put," we now have an entire generation of investors and market writers that have never experienced a stock environment in which equities actually fall according to the health of their corresponding companies or the economy at large. The past year has been a bit of a shock for them, and it's only going to get worse.

The Fed's large scale interventions in stocks are now essentially over, which is exactly why stocks are no longer hitting new historic highs every month as they used to. The massive bull market rally of the post credit crash world of 2008 has stalled, and here are the reasons why.

Central Banks Tapering QE

The Federal Reserve was only the first to begin tapering its purchases of treasury bonds. Japan is now in the midst of what many are referring to as a "stealth taper" of its own bond purchases. TheEuropean Central Bank has announced it will likely end its QE program by the end of this year. Bond purchases helped first to support the ever growing debt burden of the governments and nations in question, but along with artificially low interest rates, it made bond investment less desirable in terms of profits. This pushed the majority of investors into stocks, where profits were essentially guaranteed by the central banks.

Now that QE is ending around the world and rates are rising along with yields, bonds are becoming a competing asset, luring investors away from stocks once more.

Central Banks Raising Interest Rates

The Federal Reserve has been raising rates consistently since the end of 2016, exactly as I predicted they would before the U.S. election.  Interest rates are a direct influencing factor in stocks — low interest rates and cheap overnight loans to corporations by the Fed allowed these companies to continually buy back their own stocks, thereby decreasing the number of stock offerings available on the market and artificially boosting the value of the stocks that were left circulating.

Corporation have taken on a historic level of debt not seen since 2007 in order to keep their stocks prices high. Now that interest rates are rising, the party is almost over. The only source of capital left to fuel the stock buyback bonanza has been the Trump corporate tax cut.  Instead of using this cut as a means to increase employment, innovation and to bring manufacturing back to the U.S., companies have instead squandered it on boosting the stock market yet again. However, as we have seen this year so far, without the aid of cheap money from the central bank the effects of stock buybacks are diminishing.

How long will it take for corporations to completely exhaust this last revenue stream? I predict stock buybacks will die off by the end of this year. And with rising interest rates, all that debt they took on in order to keep stocks elevated will now become rather expensive to hold onto. Once stock buybacks diminish, markets will crash.

It's important to note that the Fed is not the only central bank that is raising interest rates. The Bank of Canada and the Bank of England among others are beginning to push higher rates as well.

Federal Reserve Cutting Balance Sheet (And Hiding The Effects)

The Fed has been the single most important trigger for stock markets. Period. As noted above, it was the Fed that created the historic bull market rally after the derivatives collapse. Jerome Powell, the current chairman of the Fed, stated back in 2012 that this was the case, and also made statements on what would happen if the Fed ever raised interest rates and cut asset purchases, ending the central bank's "short volatility position."

What did Powell predict in 2012? Essentially, a stock market crash. And, yet, as the new Fed chair he is implementing the exact measures he warned about back in 2012.

With every new balance sheet cut and rate hike, the Dow Jones in particular tends to lose 1,000 points or more. The damages have been mitigated by continued stock buybacks from corporations as well as smaller asset purchases by the Fed after the fact, but as already mentioned, the buyback stop gap will be ending shortly.

I should also note that the St. Louis Fed recently ended its reporting of data on cuts from week-to-week (known as FRED data). There are other sources for this data, but they mainly show how much was cut per month, not WHEN in the month those cuts were made. The St. Louis data was originally reported on a weekly basis, which means we can more closely compare Fed asset cuts to stock market movements.

If we look at a 2018 year-to-date chart of the performance of the Dow Jones side by side with the St. Louis FRED chart of balance sheet cuts before the Fed discontinued it, we can see for example that on January 24th the Fed made a dramatic cut in their balance sheet, and two days later on the 26th the Dow began to drop precipitously.  On February 7th the Fed increased asset purchases slightly, and only two days later stocks began to recover.  On February 21st the Fed cut dramatically once again, and once again stocks plunged.  On March 2nd the Fed added a smaller level of assets and stocks recovered.  I would also note that when the Fed does not cut, but simply keeps assets mostly static as in May, stock rise.  Like clockwork, only when the Fed dumps its balance sheet do stock markets fall.

I believe the Fed is not attempting to hide the size of its asset dumps when it discontinued FRED data, but it is attempting to hide the exact TIMING of when the cuts occurred.  In this way, they hope to distance themselves from any blame by making it more difficult to connect Fed cuts to specific weekly plunges in stock markets.

As a side note, the argument that market plunges and rallies are somehow due to algorithmic computers and not the Fed is misguided.  FRED data was normally released long after stock movements had already begun.  Meaning, any influence algorithms might have had came AFTER the fact, not before or during the Fed's balance sheet actions.  Algos are not magic despite predominant and odd misconceptions; they DO NOT predict the timing of Fed asset cuts or purchases.  They do nothing more than lag behind the already direct influence of the Fed on equities.

The Fed is also suddenly attempting to change the way it reports on Yield Curve data, which has in the past been a very accurate indicator of when a recession will take place.  Why?  Most likely because the Fed has been pushing the claim that the economy is in swift recovery when their own data shows that it is actually in swift decline.  The Fed needs a rationale for their rate hikes and balance sheet cuts - actions which they KNOW will cause the next financial crash.  The central bankers are hiding FRED data and Yield Curve data because they are deliberately sabotaging what remains of the US economy, and they are seeking to do this without taking any responsibility.

Trade War Distraction

The trade war continues as the most effective possible distraction from central bank activities. In every instance of a stock market decline, which takes place after every instance of a Federal Reserve cut in the balance sheet or an interest rate hike, Donald Trump also seems to make yet another trade war announcement.  During Jerome Powell's most recent congressional hearing, discussion strayed far from any examination of the Fed's culpability for economic weakness.  Instead, the majority of questions revolved around the "threats" presented by Trump's tariffs and their negative affects on markets.

The only outlier has been the "official launch" of the trade war with China, which saw stock markets suddenly rise.  I have witnessed numerous analysts and commentators frantic over the fact that stocks did not fall on the headlines. Some have even suggested that the investment world "loves the trade war."

What these commentators do not understand is that the headlines are meaningless and the trade war has little to do with the behavior in equities. It is the Federal Reserve and to some extent other central banks that are controlling stock market prices, along with corporate stock buybacks which are facilitated by the Federal Reserve's low interest rates.

I've said it before and I'll say it again — what we are witnessing is a controlled demolition of the U.S. economy, and stock markets are merely an extension of this process. They are a lagging indicator, not a leading indicator. Stocks fall when the Fed dumps more assets, and these cuts are growing larger and larger as 2018 drags on. Stocks rise when the Fed slows asset cuts in a particular week, or when companies initiate more stock buybacks. That's it. That is all there is. There is nothing else to look at when predicting what stocks will do at any given time.

The facade will end when balance sheet cuts expand to a point at which buybacks cannot keep up and the slack in markets grows too fast.  Or when stock buyback cash runs out (probably by the end of this year). The trade war can and will cause various problems within the global economy, but the greater cause of fiscal distress will always be central banks. They are to blame for any future crisis.
Trump Blasts Fed: "Not Thrilled" About Rising Rates, Says Strong Dollar "Disadvantageous"

Update: and as has been the case recently, the White House had to immediately clarify what Trump meant:

  • WHITE HOUSE SAYS TRUMP `RESPECTS THE INDEPENDENCE' OF FED
  • WHITE HOUSE SAYS TRUMP ISN'T INTERFERFERING WITH FED DECISIONS

In response, the USD staged a feeble bounce which is already being faded.

* * *

It should perhaps come as no surprise that the president who once called himself a "low interest rate guy", has finally laid into the Fed, and during an interview with CNBC's Joe Kernan, criticized the US central bank saying that he is "not thrilled" about rising rates, and would prefer a weaker dollar to offset the Chinese Yuan which is "dropping like a rock."

"I'm not thrilled," he told Joe Kernen.

"Because we go up and every time you go up they want to raise rates again.

I don't really...

I am not happy about it. But at the same time I'm letting them do what they feel is best."

"But I don't like all of this work that goes into doing what we're doing."

Trump also said he's concerned that the timing of the Fed's rate hikes may be poor and the resulting strong dollar will put the U.S. at a "disadvantage" while the Fed's counterparts like the European Central Bank and the Bank of Japan maintain loose monetary policy.

The statements, which could have comes from Turkey's Erdogan on any given day, and which will immediately be seen as threatening the Fed's independence, is sure to spark another meltdown, this time in the business media.

The president acknowledged that his comments are unusual but said he doesn't care.

"Now I'm just saying the same thing that I would have said as a private citizen," he said.

"So somebody would say, 'Oh, maybe you shouldn't say that as president. I couldn't care less what they say, because my views haven't changed."

"I don't like all of this work that we're putting into the economy and then I see rates going up," he said.

Finally, hinting that trade war is about to become a full-blown currency war, Trump confirmed that he is well aware of what is going on China where the Yuan has been crashing relentlessly for the past month, and said that the Chinese currency is "dropping like a rock"... which it is:

Full interview below:

Gold spiked:

And stocks hiccuped...

And while Trump's unorthodox comments are sure to set off a firestorm of criticism and complaints that Trump is seeking to eliminate the Fed's independence, which of course it isn't, because as Ben Bernanke's former advisor once admitted, "A lot of people would be stunned to know the extent to which the Federal Reserve is privately owned", here is an excerpt from the NYT, showing how previously US presidents handled Fed "independence":

However, since it is all about preserving the "narrative", the blowback was immeidate with Former Dallas Fed President Richard Fisher telling CNBC that Trump is out of line.

"One of the hallmarks of our great American economy is preserving the independence of the Federal Reserve. No president should interfere with the workings of the Fed," Fisher said. "Were I Chairman Powell, I would ignore the President and do my job and I am confident he will do just that."