mercoledì 7 febbraio 2018

BofA: This Was A "Minsky Moment" For The VIX

While Monday's historic spike in the VIX may be fading from memory - for now - it is certainly the case that the short-vol imbalances have hardly been removed from the market: while the short VIX ETN industry may have been eliminated, following several "termination events" for ETNs such as the XIV, it represented only $3 or so billion in assets; as such it is a small fraction of the total systematic vol sellers, including Risk Parity funds, CTAs, vol targeters, annuity funds and according to Fasanara Capital, everyone else, in what is one massive, $22 trillion, low-vol bet.

Even more modest calculations suggest that as much as $1.5 trillion is invested in funds with volatility-linked strategies, still a colossal sum. From the WSJ:

In a prescient research paper published in November, Vineer Bhansali, founder of investment advisory firm LongTail Alpha, and Professor Larry Harris of the USC Marshall School of Business explained how such a dramatic move might happen, and warned that "the extraordinary growth of short volatility strategies creates risks that may trigger the next serious market crash."

The paper suggests that the growth in the use of such strategies and the correlation between them risked a dramatic reversal as investors scramble to cover their short positions.

To cover a short position, investors who are directly shorting volatility buy back the asset they sold in the first place—in this case, volatility.

Risk parity or volatility target funds are a similar source of potential further sharp moves. Such funds aim to invest in assets based on their volatility, rather than allocating funds in a predetermined way to different asset classes.

When volatility spikes, that strategy involves selling the newly volatile underlying assets and rotating to more stable holdings such as cash.

Messrs. Bhansali and Harris estimated that $1.5 trillion was invested in funds with volatility-linked strategies, a colossal sum capable of shifting global markets.

For now, however, the panic over the VIX surge has stabilized, and today the fear index is already down over 20%, tumbling from 30 to 22. Still, before everyone assumes that all is well and the crisis has been averted - when in reality what happened on Monday merely let out some of the record pressure within the vol complex - here is Bank of America's derivatives expert, Benjamin Bowler, explaining why what happened on Monday was a Minsky Moment for the VIX, and also why the real crash can only take place once the volatility panic in equities spreads to other asset classes.

* * *

Wake up call for short equity vol, by Bank of America's Benjamin Bowler and team.

US equity centric shock + short vol makes VIX ground zero

The sell-off in US equities Monday (S&P cash down 4.1%, futures down 5.4%) was the worst one-day S&P decline since 2011, and ended the 90 year record just set in recent weeks for the longest period without a 5% S&P pullback.

So far, the bulk of the stress has been equity centric (Chart 7), and by far the largest shock has been to US equity vol, where the moves in VIX and VIX futures exceeded anything in recorded history. Chart 8 compares VIX to the similar measures for US Treasuries (MOVE), FX (CVIX), and Gold (GVZ).


A "Minsky Moment" for the VIX

While we did not see short volatility positioning as large enough or levered enough to catalyze the next global crisis, we were concerned about the risk of an outsized VIX spike in 2018 with little forewarning, potentially amplified by a short vol positioning squeeze.

February 5th delivered exactly such a VIX spike, with the constant maturity VIX 1-month future recording its largest spike in history (by a wide margin) relative to the decline in US equities (Chart 11). Indeed, the 94.4% rise in the constant maturity VIX 1M future was nearly 17.5x as large as the -5.4% drop in e-mini futures, easily the largest stress beta recorded (data since Sep-07) and a large enough percentage rise to leave some popular short volatility strategies at risk of losing 100% of their capital.

Particularly striking was the acceleration in the vol spike between 4pm and 4:15pm (Chart 12), when the front-month VIX futures contract rose nearly 10 vol points and the second-month contract rose nearly 8 vol points. For context, the largest close-to-close move ever recorded in the constant maturity VIX 1M future was ~5.5 vol points in Brexit. A likely driver of the parabolic vol spike into the close on 5-Feb was the sizeable rebalancing needs of levered and inverse VIX products, which by our estimates may have bought ~$250mn vega or a record 26% of the day's volume ($930mn vega) traded in the front two VIX futures contracts.

Despite the pain likely being felt by some in the short vol community, it is important to remember that the size of potential losses here is a fraction of the broader active risk-taking market. For example, even if some popular short volatility strategies lose 100% of their capital, this would likely be several orders of magnitude less than the ~$1tn loss in S&P 500 market capitalization experienced on 5-Feb.

Note that with VIX futures now at a significantly higher base level and the short vol positioning embedded in "inverse VIX" products significantly de-fanged, an imminent repeat of the events of 5-Feb becomes less acute, in our view.


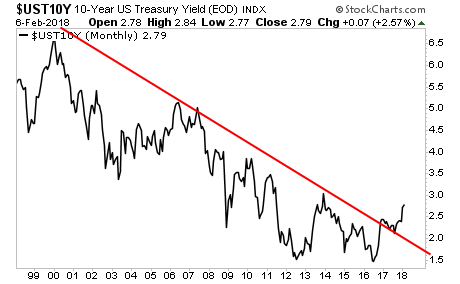
This is an equity tantrum not a bond tantrum which is comforting

While many suggest this shock was driven by concerns of inflation leading to faster than expected policy normalization (the right thing to be concerned about in our view), rates have been incredibly stable compared to past bond-led shocks such as the taper tantrum (Chart 9, 10). In fact, Treasuries rallied Monday in a flight-to-quality (perhaps aided by CTA positioning), but the fact this shock so far is very equity centric is positive. Key to understanding whether this is a short-term technical equity sell-off, which quickly reverses, or the beginning of something bigger, lies in where rates vol goes from here.

Rickards: Establishment Insiders Are Flashing Red Warning Lights

Barely a week after it set another record high, the Dow just suffered its worst one-day loss in its entire history. While the latest turmoil hasn't reached the crisis level by any means, I've been warning about a correction for months. Warnings about an imminent collapse of developed economy stock markets, especially the U.S. markets, have been everywhere. Whether you use Shiller's CAPE ratio, Warren Buffett's preferred market-cap-to-GDP ratio, or traditional P/E ratios, markets were overpriced and ready to fall. Of course, that did not mean they would fall anytime soon, or on anyone's timetable. As we saw in the dot.com bubble of 1996-2000, and the housing bubble of 2002-2007, so-called "irrational exuberance" can last longer than the skeptics believe. However, some warnings perhaps deserve more attention than others. Anyone can sound warnings about doom and gloom or stock market crashes. But those Cassandras are not worth listening to unless they offer facts and analysis to support their views. Opinions without something solid to back them up are just that — opinions. The warnings I pay most attention to are those from establishment insiders.

These are the kinds of individuals who attend Davos and routinely discuss market conditions with central bank heads, finance ministers and people like Christine Lagarde, head of the IMF. The credibility of such insiders is enhanced ever further when they come with serious academic credentials such as an economics Ph.D. from a top university in the field. William White is such an individual. He was former head of the OECD review board and former chief-economist for the BIS, the "central bankers central bank" based in Basel, Switzerland. In a recent interview, White flatly declared, "All the market indicators right now look very similar to what we saw before the Lehman crisis, but the lesson has somehow been forgotten." You can't get much more of a blinking red light than that. Heading into this year, I called 2018 "The Year of Living Dangerously." That description seemed odd to lot of observers. Major U.S. stock indexes kept hitting new all-time highs, which continued through the end of January. Even in strong bull market years there are usually one or two down months as stocks take a breather on the way higher. Not last year. There was no rest for the bull; it was up, up and away. The unemployment rate has been at a 17-year low. U.S. growth was over 3% in the second and third quarters of 2017. It underwhelmed in the fourth quarter at 2.6%, but it was still above the tepid 2% growth we've seen since the end of the last recession in June 2009. The U.S. hasn't been alone. For the first time since 2007, we were seeing strong synchronized growth in the U.S., Europe, China, Japan (the "big four") as well as other developed and emerging markets. In short, all has been right with the world. Or not.

To understand why I said 2018 may unfold catastrophically, we can begin with a simple metaphor. Imagine a magnificent mansion built with the finest materials and craftsmanship and furnished with the most expensive couches and carpets and decorated with fine art. Now imagine this mansion is built on quicksand. It will have a brief shining moment and then sink slowly before finally collapsing under its own weight. That's a metaphor. How about hard analysis? Here it is:

Start with debt. Much of the good news described above was achieved not with real productivity but with mountains of debt including central bank liabilities. In a recent article, Yale scholar Stephen Roach points out that between 2008 and 2017 the combined balance sheets of the central banks of the U.S., Japan and the eurozone expanded by $8.3 trillion, while nominal GDP in those same economies expanded $2.1 trillion. What happens when you print $8.3 trillion in money and only get $2.1 trillion of growth? What happened to the extra $6.2 trillion of printed money? The answer is that it went into assets. Stocks, bonds, emerging-market debt and real estate have all been pumped up by central bank money printing.

What makes 2018 different from the prior 10 years? The answer is that this is the year the central banks stop printing and take away the punch bowl. The Fed is already destroying money (they do this by not rolling over maturing bonds). Last week, the Fed reduced its balance sheet by $22 billion. While that doesn't seem like much when you're talking about a $4 trillion balance sheet, it was the Fed's largest cut to date. Funny how the market hit the skids just after this happened. But you haven't heard the mainstream media mention that. By the end of 2018, the annual pace of money destruction will be $600 billion — if the Fed under new chairman Jerome Powell stays on course. The European Central Bank and Bank of Japan are not yet at the point of reducing money supply, but they have stopped expanding it and plan to reduce money supply later this year. In economics everything happens at the margin. When something is expanding and then stops expanding, the marginal impact is the same as  hrinking.

Apart from money supply, all of the major central banks are planning rate hikes, and some, such as those in the U.S. and U.K., are actually implementing them. Reducing money supply and raising interest rates might be the right policy if price inflation were out of control. But despite a recent uptick in some inflation measures, prices have mostly been falling. The "inflation" hasn't been in consumer prices; it's in asset prices. The impact of money supply reduction and higher rates will be falling asset prices in stocks, bonds and real estate — the asset bubble in reverse.

And as the past few days show, the problem with asset prices is that they do not move in a smooth, linear way. Asset prices are prone to bubbles on the upside and panics on the downside. Small moves can cascade out of control (the technical name for this is "hypersynchronous") and lead to a global liquidity crisis worse than 2008. This will not be a soft landing. The central banks — especially the U.S. Fed, first under Ben Bernanke and later under Janet Yellen — repeated Alan Greenspan's blunder from 2005–06. Greenspan left rates too low for too long and got a monstrous bubble in residential real estate that led the financial world to the brink of total collapse in 2008.

Bernanke and Yellen also left rates too low for too long. They should have started rate and balance sheet normalization in 2010 at the early stages of the current expansion when the economy could have borne it. They didn't. Bernanke and Yellen did not get a residential real estate bubble. Instead, they got an "everything bubble." In the fullness of time, this will be viewed as the greatest blunder in the history of central banking. Not only that, but Greenspan left Bernanke some dry powder in 2007 because the Fed's balance sheet was only $800 billion. The Fed had policy space to respond to the panic of 2008 with rate cuts and QE1. Today the Fed's balance sheet is over $4 trillion. If the current rout becomes a full-blown panic, or even if it is delayed until later, the Fed's capacity to cut rates is only 1.5%. And its capacity to expand the balance sheet is basically nil, because the Fed would be pushing the outer limits of an invisible confidence boundary. This conundrum of how central banks unwind easy money without causing a recession (or worse) is just one small part of a risky mosaic. For now, think of 2018 as the year of living dangerously. Smart investors should prepare now with reduced exposure to stocks and increased allocations to cash and gold.

The Bull Market in stocks is dead, to be precise it will be after next historical max, until this happens

For weeks we've been pounding the table that the bond market was flashing "danger." Just about everyone else on the planet was claiming, "rising rates don't matter."

We now know how that turned out.

Indeed, High Yield Credit (junk bonds) peaked well before stocks did. Again, the debt markets were screaming trouble was coming. But 99% of investors were not prepared. 


The truth is that the Fed is way behind the curve. Inflation is back and it's endangering the bond bubble. Until the Fed or someone else reins in the bond market, there is no significant rally coming to the markets.


Put another way, until the bond market is back under control and yields fall, the bull market in stocks is over.

Is the 9-Year Long Dead Cat Bounce Finally Ending?

Ignoring or downplaying these fundamental forces has greatly increased the fragility of the status quo.

The term dead cat bounce is market lingo for a "recovery" after markets decline due to fundamental reversals. Markets tend to bounce back after sharp declines as participants (human and digital) who have been trained to "buy the dips" once again buy the decline, and the financial media rushes to reassure everyone that nothing has actually changed, everything is still peachy-keen wonderfulness.

I submit that the past 9 years of market "recovery" is nothing but an oversized dead cat bounce that is finally ending. Here is a chart that depicts the final blow-off top phase of the over-extended dead cat bounce:


Why are the past 9 years nothing but an extended dead cat bounce? Nothing that's fundamentally broken has been fixed, and none of the dynamics that are undermining the status quo have been addressed.

The past 9 years have been one long dead cat bounce of extend and pretend, i.e. do more of what's failed because to even admit the status quo is being undermined by fundamental forces would panic those gorging at the trough of the status quo's lopsided rewards.

This 9-year dead cat bounce was pure speculation driven by cheap central bank credit and liquidity. Demographics, environmental degradation, the decline of middle class security, the erosion of paid work, the bankruptcy of public and private pension plans, the global debt bubble, soaring wealth and income inequality, the corruption of democracy into a pay-to-play bidding war, the destruction of price discovery via market manipulation by those who have turned markets into signaling devices that all is well, the laughable distortion of statistics to mask the real world decline in our purchasing power (inflation is near-zero--really really really), the perverse incentives to leverage up bets in financial instruments that have no connection to the real-world economy--none of these have been addressed in the market melt-up.

Rather, ignoring or downplaying these fundamental forces has greatly increased the fragility of the status quo.

Stock Market Plunge Protection Team Spotted Atop Mount Everest!

Many market observers would agree that the current stock market is either in a bubble or at least richly valued by historical standards. Not that it matters. The Dow's ascent looks like Mount Everest complete with a lack of oxygen at the top. All that has mattered when it comes to stocks for thirty years now is the Federal Reserve and their 'Plunge Protection Team (PPT)' activities.

When stocks needed a boost, they were there to buy market indices back up when no one else would dare. Since the election of President Donald Trump, market indices have been moving straight up. The PPT has not been needed. There have been no sell-offs. That is, until the very end of January, 2018. Even then, the Dow dipped just a couple of percentage points.

Why? As I mentioned, everyone agrees the current market is a bit pricey or perhaps even bubbly. Maybe the stock indices are due for a pullback. But mainly, investors are gauging the Fed's anticipated moves. The Fed is raising their fed funds interest rates and in turn, the US 10-year Treasury yield has risen to over 2.7%. That doesn't sound like much but yields haven't been this high in four years and the stock plunge of '08 was triggered in part by yields in the upper 4% range. One or two more bumps from the Fed and US 10-year Treasuries might well yield north of 3%. Since we have been living in an economy propagated by near-free money, maybe a rising cost trajectory of money will trigger the next bear in stocks? The future of stock indices really is in the hands of the Fed.

So we finally got not one but two days of selling in the US stock indices largely due to Fed worries. Alas, the Fed met on January 31 and took no action.

Selling intensified after the Fed's announcement on the 31st and then the clock struck 3PM. And out they popped. I could hear the sirens sounding the alarm from my office! Suddenly, from nowhere, buying programs kicked in. On Donar and Blitzen and…, oh wait a minute -that's a different Santa Claus! I personally measure PPT activity when the Dow experiences at least a 100-point upside move in an hour. By the end of the trading day, the Dow had recovered nearly half of the days 300-plus point intraday loss. All in less than an hour!

The green circles on the chart below show suspect buying activity that is likely PPT action as previously defined. The next morning (February 1) Dow futures were down over 200 points. Ding-a-ling-ling the Dow opened for trading. The next green circle shows a quick 200 point recovery in about thirty minutes. Yeah, that's normal. A little more selling pushed the Dow lower and then a third PPT program kicked in. More selling threatened to send the Dow down for the day but that was not allowed. The fourth green circle shows an end-of-the-day buying spree reminiscent of the previous day. This is a 10-minute interval chart so check out the trading volume at the bottom bar particularly at the end of the day Feb. 1.


DJIA - 2-day, 10-minute interval 1/31/18 - 2/1/18
Chart courtesy StockCharts.com

What does this tell us? What does the Fed want us to believe?

One - Even though Dow valuations are very high, the Fed does not care if they are standing atop Mount Everest. They are going to grow the mountain higher. All they care about is their evil luciferian control over all of us.

Two - The Fed is willing to support stock prices as they raise interest rates.

Three - The Fed is perfectly willing to blow bubbles as long as they get to search all partiers for sharp objects.

Four - The mood suddenly feels like early 2009 again as the Fed signals for us to don the oxygen masks. We are about to do some climbing. They will not let us fall.

Five - The Fed now realizes that the party is almost over. They must once again assume full control of stock price direction.

Six - A fall from atop Mount Everest will certainly result in death.

We may have a million good reasons to sell stocks and wait for the crash, but we only need one good reason to ignore risks and buy our brains out. That is, we can see the PPT standing atop Mount Everest with buy orders in their hand. But is this action prudent and will the Fed again find success?

If the Fed fails now, we are likely going to experience a very different world on the other side of the QE - PPT door.

When You Buy Your Own Supply: The Fed's Plunge Protection Team

What happens when there are almost no organic stock market buyers left? When the valuations are so inflated and fear is so great that the freefall can't find a bottom? Well, that's when the federal government steps in and buys. Fake economic growth, meet fake stock market demand. Enter the Plunge Protection Team.

As futures were crashing in after-market trading, the question of who will step in to turn the market around should be pretty obvious. I'm betting on a buyer with unlimited access to new funds and a buyer unconcerned with profit motive. That the PPT or Plunge Protection Team would be deployed soon seems pretty likely.

If you're unfamiliar, per Investopedia:

"Plunge Protection Team" was the nickname given to the Working Group on Financial Markets by TheWashington Post in 1997. The team consists of the Secretary of the Treasury, the Chairman of the Board of Governors of the Federal Reserve, the Chairman of the SEC and the Chairman of the Commodity Futures Trading Commission.

It was initially perceived by some to have been created solely to shore up the markets or even manipulate them. The team was created in response to the 1987 market crash.

The theory is that the team manipulates markets by executing trades on several exchanges when the market isn't behaving as it would like. It is said to only work with big banks such as Goldman Sachs and Morgan Stanley, only to report to the President, and to keep no records of trades.

Profit of PTT action stay long for a while but, as technical indicators flash red go back shorting market!


So What Do I Think about the “Crash” in Stocks?

A lot more will have to happen before this turns into a crash; and markets 
are not there yet.

With all this wailing in the media about stocks, you'd think there's at least
some blood in the streets. But no. Not a drop.

The Dow fell 4.6% today to 24,345. This 1,175-point drop, as it was endlessly
repeated, was the biggest point-drop in history – but irrelevant given 
how relentlessly inflated the industrial average had become. The percentage
drop today, combined with the drops of last week, took the Dow down just 
8.5% from its all-time high on January 26.

For the year, the Dow is down merely 1.5%. I mean, what horror. The last
time this sort of debacle happened was way back in ancient history of 
January and early February 2016.

The Dow is not even in a correction (defined as -10% from its recent high).
But that messy Friday and Monday, following a record 410-day streak 
without a 5% decline, did break the recently pandemic illusion that you 
cannot lose money in stocks.

When the Dow gained 1,000 points in the shortest time ever, after having
already booked the fastest-ever 1,000-point gains in prior months and
years, no one was complaining about it. These rapid-fire 1,000-point-gains
had become the new normal. So today, one of those 1,000-point gains has
been unwound.

The S&P 500 dropped 113 points, or 4.1%, to 2,648. This took the
index back to December 8, 2017. The past six trading days were the worst
decline since … well, since the weeks leading up to February 7, 2016,
at which point the S&P 500 was off 19%, not quite enough for a dip into
an official bear market.

The Nasdaq fell 272 points today, or 3.8%, to 6,967, below 7,000 for the
first time since the end of December, but remains, if barely, in positive
territory for the year.

What'll happen next? Dip buyers will come in, maybe at this very moment,
or maybe later, and some of them will likely get plowed under, but there
is way too much cash lined up in hedge funds specifically set up to profit 
from sell-offs. And dip-buyers have been rewarded relentlessly over the
past eight years, and it's not until the dip buyers get massively destroyed
and stop dip-buying that the market is in real trouble.

Because nothing goes to heck in a straight line.

But already, the coddled soothsayers on Wall Street are blaming the Fed.
These are the same ones that could never get enough QE, that insisted
on calling QE-3 "QE Infinity," clamoring at the time for eternal 
scorched-earth-monetary policies so that asset prices would recklessly
get inflated to the moon. They're the same ones now clamoring for 
the Fed back off its "normalization" strategy.

They just sound like silly little crybabies that cannot deal with markets
attempting however briefly and feebly to do some price discovery on 
their own.

Compared to the sell-off that has been crushing cryptocurrencies – 
even the largest ones have plunged 50% to 80% from their peak a month
ago – the sell-off in stocks so far is mild. Oil sold off too. As did some
other commodities and assets. And as confidence in them began to wobble,
there are some things that have been rising over past few days, including 
gold prices.

As usual when too many retail investors suddenly realize that something
is up, and they want to get their goods onto dry land, it didn't work.
The websites of a number of online brokers, mutual fund firms, and 
fintech robo-advisers went down at least briefly under the onslaught of traffic.
They included Charles Schwab, TD Ameritrade, Vanguard Group, T. Rowe
Price, robo- adviser fintech startups Wealthfront and Betterment, and others.

This sort of thing happens frequently: When retail investors are rattled and 
are trying to sell, the system breaks for them. This shows how hard it
can be for those waiting to sell at the absolute peak — if they could even 
identify it — to be able to get out at that peak, when everyone is trying
to get out at the same time.

So do Friday and Monday count as a "rout?" Yes. But a crash? No. Far from
it. A lot more will have to happen before this turns into a real crash, and
markets are not there yet. But many people will need to get used to a new
sensation in their lives: losing money in stocks.

In terms of bonds, it's only a question of how disruptive the adjustment will be,
whether it will be just a painful sell-off or junk-bond mayhem.