lunedì 29 gennaio 2018

How Long Before The Bond Selloff Slams Stocks? Wall Street Answers


Back in November 2016, when bond yields were surging in the aftermath of Donald Trump's election, Goldman, together with SocGen, JPM, RBC and various other banks, answered the question that has once again become especially relevant: how high can 10Y bond yields go before they start to hurt equities?

Over a year ago, Goldman answered that "the equity market is still at a level that can cope with moderately rising bond yields. We estimate that a rise in US bond yields above 2.75% or probably between 0.75-1% in Germany would create a more serious problem for equity markets: at that point we would expect the correlation between bonds and equities to be more positive - i.e., any further rises in yields from there would be a negative for stock returns."

2.75% is also the level above which JPM's head quant Marko Kolanovic said the 10 Year would begin to cause problems for stocks: "should bond yields continue increasing (e.g. 10Y beyond 2.75%) this will risk an equity sell-off that usually triggers a broader deleveraging of var-based strategies."

More recently, Jeff Gundlach warned that "if the 10Year goes to 2.63%, stocks will be negative impacted." As of this morning, the 10Y yield rose as high as 2.7216% - a level not seen since early 2014 - before fading some of latest surge.


So fast forward to today when overnight SocGen's strategist Kit Juckes rekindles the conversation of how long before the bond selloff morphs into an equity selloff - one which both Bank of America and now Goldman expect will hit over the next three months - by comparing equity investors to frogs who are about to be caught in boiling water.


"The frog analogy (it doesn't realise it's getting boiled until it's too late to escape) is likely to be popular in 2018" - Socgen


In his note "How long before the bond sell-off heats up markets?", Juckes points out he may "as well get an early vote in for 'boiling frogs in rising yields' as the next market theme." Still, contrary to November 2016, the Socgen strategist doesn't see a critical resistance level beyond which stocks tumble, at least not yet.

A slow-motion rise in bond yields is not, yet, threatening risk sentiment in equities, credit or EM. As long as it doesn't, yields can rise on a tide of decent economic data and expectations of higher inflation thanks in no small part to rising oil prices. The frog analogy (it doesn't realise it's getting boiled until it's too late to escape) is likely to be popular in 2018. For now, we're basking in synchronised growth and thinking happy thoughts......

Those thoughts may be far less happy if the market takes a long, hard look at the crashing US savings rate and realizes its broad, deflationary implications for the broader economy, and the fact that the recent, GDP -boosting spending surge is coming to an abrupt end.


And while we were disappointed by Juckes' lack of a concrete target for a level in the 10-Year which would slam stocks, conveniently his employer put out a table back in November 2016 which answered the question on everyone's lips: when will bond yields start to hurt equities. Or, as SocGen would say: "we are already there."

Treasury Yields Are Blowing Out, Slowing Dollar Plunge


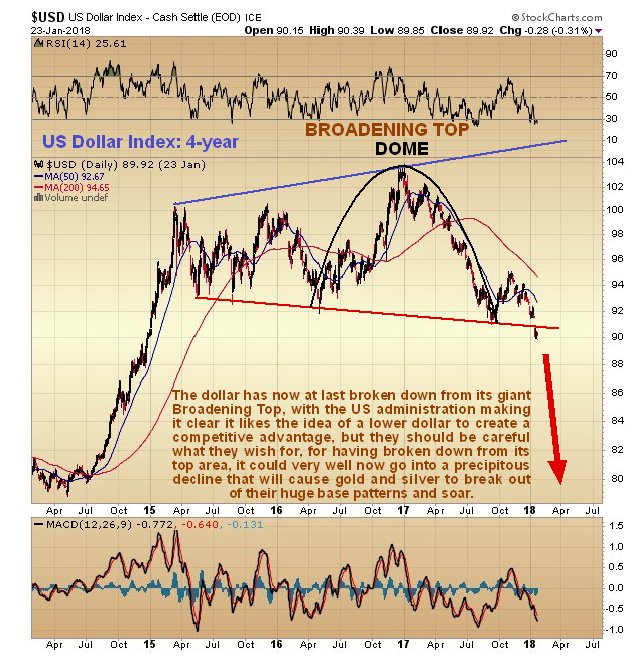
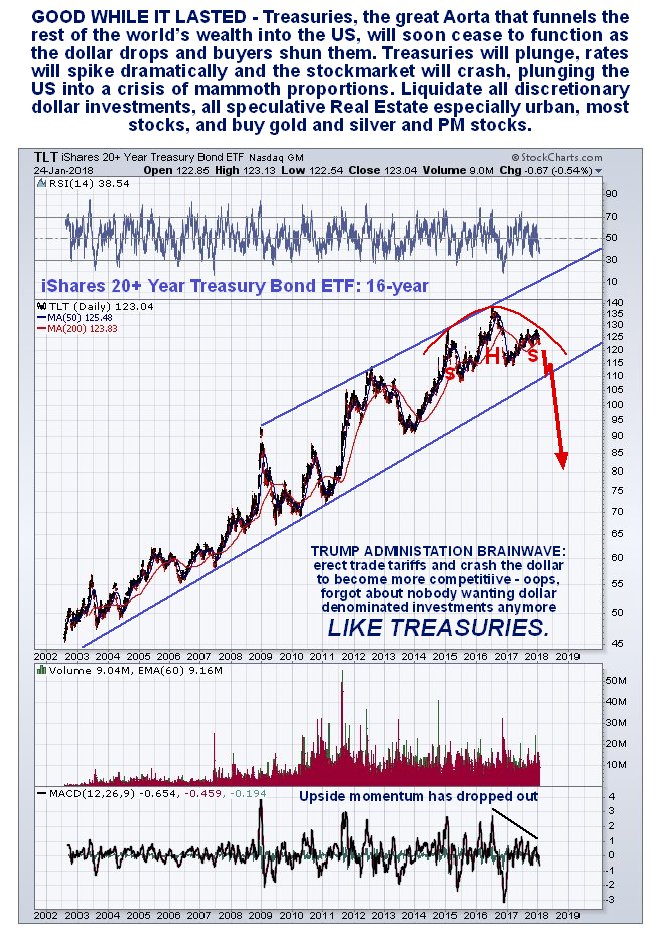
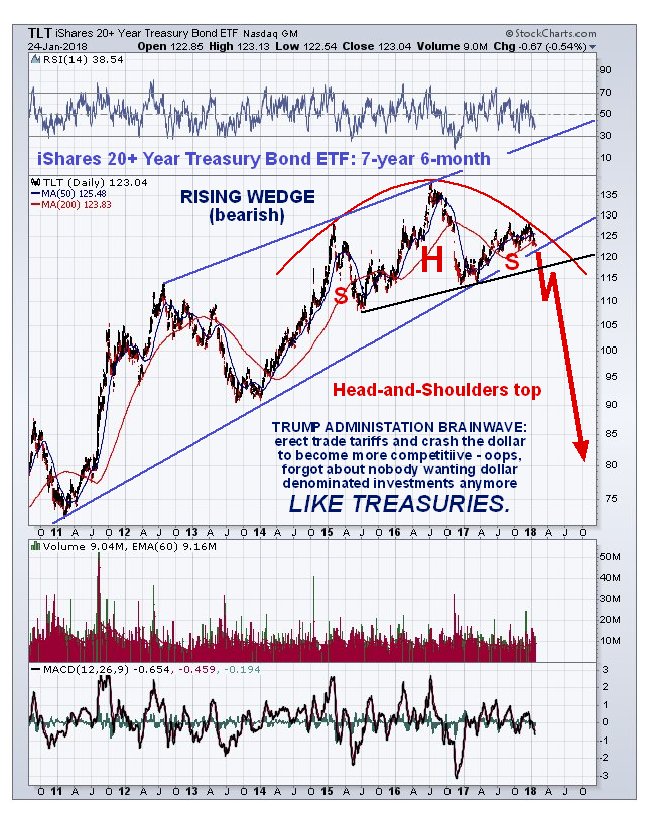
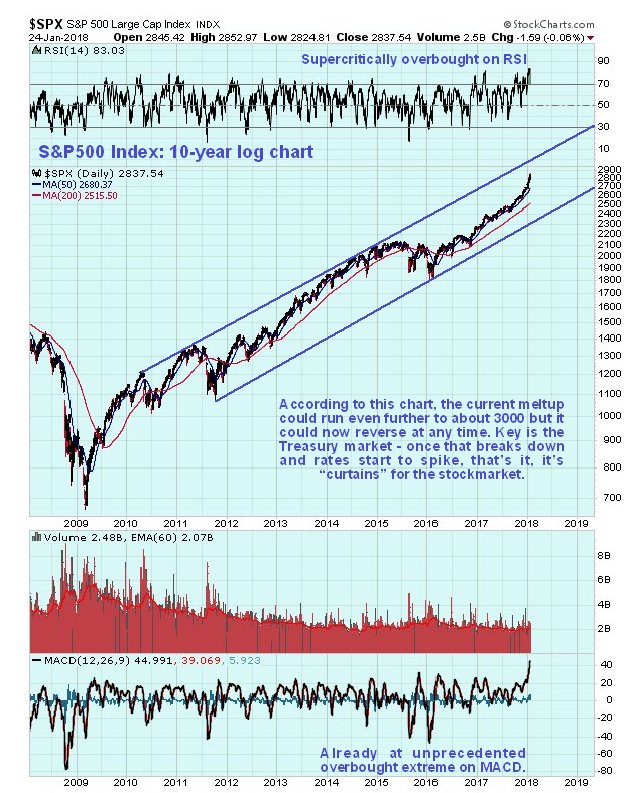
The recent frantic moves in Treasurys and the dollar continued on Monday as we enter what is set to be a juggernaut of a "rollercoaster week", and while the dollar collapse seems to have slowed for now, this is as a result of an acceleration in the Treasury selloff, with 10Y yields blowing out to 2.72% for the first time since early 2014, and now deep into what Jeff Gundlach called the "danger zone" for equities.


The TSY weakness is also hitting German Bunds, where the 10Y yield rose to 0.682%, the highest since 2015 and rapidly threatening another VaR shock should the selloff accelerate from here.


Also of notable: the German 5-year bond yield rose as much as 4bps from the open to turn positive for the first time since Dec. 2015, rising as high as 0.012% after ECB Governing Council member Klaas Knot over the weekend said there isn't a single reason to continue with the QE program.


For once, the Greenback is a broad winner, if very modestly, as high/rising US Treasury yields, now at levels last seen in early 2014, are finally offering the USD some support after 7 weeks of losses, while month-end rebalancing is also prompting short covering given buy signals and latest weekly CTFC spec positioning showing another increase in shorts. The DXY looks firmer above the 89.000 level, but really needs to extend recovery gains beyond 89.500 for a more sustained retracement and to prevent bears from further attacks on key supports below 88.500.


"The higher Treasury 10-year yield is spurring dollar-buying," said Ko Haruki, head of the financial solutions group at CIBC World Markets (Japan) in Tokyo. "The dollar is consolidating with major currencies failing to break Thursday's highs."


Meanwhile, the yen fell after Kuroda's comments on stronger inflation. GBP/USD slid as much as 0.5% to 1.4094 amid media reports that the Conservatives are poised to trigger a vote of no confidence in U.K. PM May.


The Swiss franc fell versus all G-10 peers amid speculation of possible Swiss National Bank intervention first spurred leveraged buying of USD/CHF, before sellers responded and pulled the pair back down; SNB declined to comment on the matter.


The euro weakened as German bonds retreated for a fourth day, while the Stoxx Europe 600 Index turned lower after benchmarks were mixed in the Asian session.


After trading mixed early in the session, European tech stocks retraced much of their earlier gains on Monday, as traders cited the previously noted report that Apple has cut production as much as 50% for the iPhone X. Nikkei Asian Review says Apple has alerted suppliers it has cut its production target for the flagship phone to 20 million units in Q1, from a previous estimate of 40 million envisaged in November. Apple suppliers Dialog Semiconductor DLGS.DE, STMicroelectronics STM.BN, Infineon IFXGn.DE, IQE IQE.L and AMS AMS.S all fade gains shortly after the report, though all five stocks remain up on the day after AMS reported results well ahead of expectations


In terms of sector specifics, material names outperform following price action in the metals complex with Rio Tinto, Anglo American, Glencore, Antofagasta and BHP all near the top of the FSTE 100. Elsewhere, focus has also been on the IT sector with AMS (+20%) and Wirecard (+1.7%) soaring in the wake of earnings. Other notable equity specific newsflow includes Sanofi acquiring Ablynx (+3.5%) for EUR 3.9bln and a double upgrade at BAML for Volkswagen (+1.5%) with BAML commenting on whether the Co. could be a potential break-up candidate.


Earlier, Asia-Pac bourses traded mixed: the ASX 200 (+0.4%) and Nikkei 225 (Unch.) opened positive with Australia buoyed by M&A activity including AWE shares which rose 16% on reports of a bid from Mitsui & Co., while Japan stocks were less decisive with price action dictated by currency moves and the stronger yen killed early upside equity momentum.


Notably, Chinese stocks slumped the most in 2 months as large caps retreated. Equities in Hong Kong also fell, while the big-cap CSI 300 Index loses 2% as of 2:49pm local time. Shanghai Composite Index closed down 1.3% while the Shenzhen Composite Index fell -1.7%. Some Chinese investors are closing their books before Chinese New Year, which means inflows to the stock markets will slow, said Frank Lee, acting chief investment officer for North Asia at DBS Bank (HK) Ltd.


Elsewhere, U.S. oil fell, though it's at about its strongest level in five months relative to Brent as a weaker dollar and falling stockpiles boosted the American marker. Metals advanced amid optimism over global growth and the impact of the softer greenback, with zinc soaring to the highest level in more than a decade.


Bitcoin climbed, holding its value above $11,000 even after a heist of nearly $500 million in a different digital token spurred calls for more cryptocurrency regulation


Janet Yellen's final policy meeting as Federal Reserve chair will be the main focus of investor attention in what's shaping up to be another active week for markets still finding their feet after the recent dollar selloff. There's a string of fresh economic data due, as well as a State of the Union address from President Donald Trump and earnings releases from the world's biggest tech companies.


Bulletin Headline Summary from RanSquawk 
The USD regains some ground against its major counterparts as US 10yr yields break above 2.7% 
European equities have kicked the week off with little in the way of sustained direction 
Looking ahead, highlights include US personal consumption and PCE data, NZ trade, ECB's Coeure 


Market Snapshot 
S&P 500 futures down 0.3% to 2,868.75 
STOXX Europe 600 down 0.01% to 400.53 
MSCI Asia Pacific down 0.08% to 187.07 
MSCI Asia Pacific ex Japan up 0.02% to 613.88 
Nikkei down 0.01% to 23,629.34 
Topix up 0.06% to 1,880.45 
Hang Seng Index down 0.6% to 32,966.89 
Shanghai Composite down 1% to 3,523.00 
Sensex up 0.8% to 36,332.10 
Australia S&P/ASX 200 up 0.4% to 6,075.41 
Kospi up 0.9% to 2,598.19 
German 10Y yield rose 5.1 bps to 0.682% 
Euro down 0.2% to $1.2406 
Italian 10Y yield rose 4.3 bps to 1.738% 
Spanish 10Y yield fell 0.7 bps to 1.402% 
Brent futures down 0.6% to $70.11/bbl 
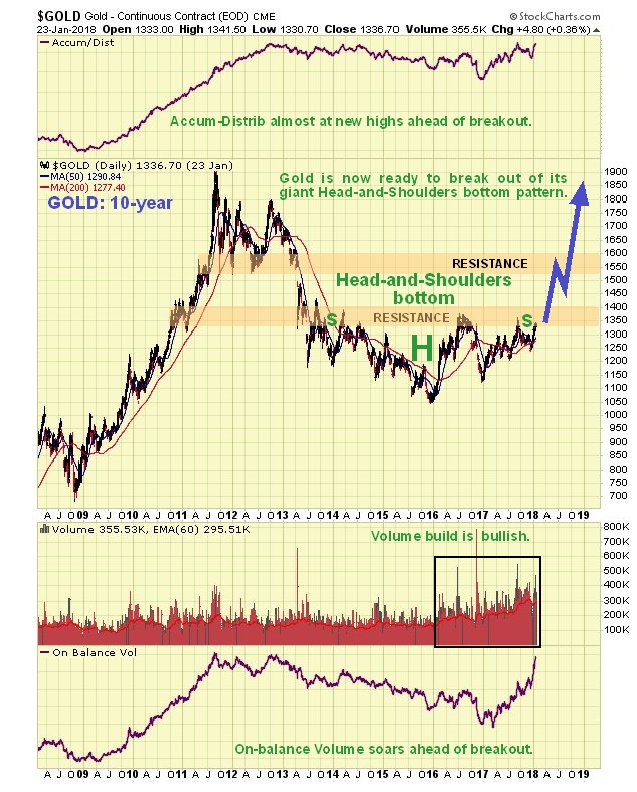
Gold spot down 0.1% to $1,348.48 
U.S. Dollar Index up 0.2% to 89.23 


Top Overnight News 
Donald Trump's presidency would "end" if he followed through on efforts to fire Robert Mueller, the special counsel leading the investigation into Russian interference in the 2016 U.S. election, said Senator Lindsey Graham 
Trump's Infrastructure Plan Hits Early Roadblock Over Funding 
Massive Cryptocurrency Heist Spurs Calls for More Regulation 
The European Central Bank has to end its quantitative easing as soon as possible, according to ECB Governing Council member Klaas Knot, who said there's not a single reason anymore to continue with the program 
Sanofi Leapfrogs Novo With $4.8 Billion Cash Bid for Ablynx 
U.S. Is Said to Consider Building 5G Network Amid China Concerns 
The bumpy journey toward Brexit reaches another fork in the road this week as the upper chamber of the British parliament plans to rewrite a key piece of Prime Minister Theresa May's legislation 
Billionaire Singh Brothers Accused in Suit of Siphoning Cash 
Germany's Social Democratic leader said he needs concessions from Chancellor Angela Merkel to sell party members on staying in her government 
Noble Group Said to Reach In-Principle Deal to Restructure Debt 
Ingvar Kamprad, Ikea's Swedish Billionaire Founder, Dies at 91 
Brexit Woes Mount for May, Fox Says 'Foolish' to Challenge Her 
Europe Closes In on Fresh Trade Deal as Trump Puts Up Barriers 
Sentiment among London's Brexit-hit bankers sank to its gloomiest depths since the 2008 financial crisis, a survey showed - a stark contrast to the bullish tone of finance executives gathered last week in Davos, Switzerland 
Japan's Vice Minister for International Affairs and currency chief Masatsugu Asakawa says officials are watching foreign-exchange markets closely as volatility has increased 


Asia-Pac bourses traded somewhat mixed, as the region failed to maintain the early broad momentum from last Friday's gains on Wall St. where sentiment was underpinned by earnings and in which all major indices closed at their all-time highs. ASX 200 (+0.4%) and Nikkei 225 (Unch.) opened positive with Australia buoyed by M&A activity including AWE shares which rose 16% on reports of a bid from Mitsui & Co., while Japan stocks were less decisive with price action dictated by currency moves. Both the Hang Seng (-0.6%) and Shanghai Comp. (-1.0%) initially conformed to the gains in which the former continued to post fresh record levels, although the tone later deteriorated amid increases in money market rates after the PBoC skipped open market operations, coupled with underperformance in Shenzhen where Leshi fell limit down for a 4th consecutive day. In addition, Wynn Macau was a notable underperformer in Hong Kong and slumped around 5% due to allegations of sexual misconduct by Wynn Resorts Chairman, CEO and founder Steve Wynn. Finally, 10yr JGBs are mildly lower as prices fell amid an initial positive risk tone in the region and alongside spill-over selling from their US counterparts, while the BoJ's Rinban operation was relatively light with the central bank in the market for only JPY 435bln of JGBs. PBoC skipped open market operations for a net daily drain of CNY 140bln.


Top Asian News


• Moody's Cautions Vietnam Against Further Monetary Easing


• Fitch Sells Stake in China Rating Firm Amid Market Opening


• Alibaba, Foxconn Invest $350 Million in Chinese Car Startup


• India Does Not Rule Out Fiscal Consolidation Pause This Year


• China H Share Euphoria Enters New Stage as Laggards Surge


European equities have kicked the week off with little in the way of sustained direction (Eurostoxx 50 flat) after a relatively mixed session during Asia-Pac trade. In terms of sector specifics, material names outperform following price action in the metals complex with Rio Tinto, Anglo American, Glencore, Antofagasta and BHP all near the top of the FSTE 100. Elsewhere, focus has also been on the IT sector with AMS (+20%) and Wirecard (+1.7%) soaring in the wake of earnings. Other notable equity specific newsflow includes Sanofi acquiring Ablynx (+3.5%) for EUR 3.9bln and a double upgrade at BAML for Volkswagen (+1.5%) with BAML commenting on whether the Co. could be a potential break-up candidate.


Top European News 
Offshore Cash Spike Rattles World's Biggest Covered-Bond Market 
Le Pen's National Front Slips in First Votes of the Macron Era 


In currencies, the Greenback is a broad winner (for once), as high/rising US Treasury yields are finally offering the USD some support, while month end rebalancing could also prompt short covering given buy signals and latest weekly CTFC spec positioning showing another increase in shorts. The DXY looks firmer above the 89.000 level, but really needs to extend recovery gains beyond 89.500 for a more sustained retracement and to prevent bears from further attacks on key supports below 88.500. 
USD/JPY has bounced off 108.50 again, but remains top heavy around 109.00 amidst offers at the big figure and a fib just above (109.07). 
EUR/USD is straddling 1.2400, but firmly supported above a 1.2344 Fib and via hawkish comments from ECB's Knot, while Cable has retreated sharply from post-Brexit vote highs (1.4345) to 1.4100 or a few pips under amidst more UK political and EU divorce agreement uncertainty. 
USD/CAD is back up near 1.2350 after mixed NAFTA noises as some reports suggest progress and others big sticking points. 
USD/CHF around the middle of a 0.9335-0.9385 range with the SNB declining comment on any intervention 
AUD/USD and NZD/USD have both backed off from recent 0.8100+ and 0.7400+ peaks on the back of softer metals/commodity prices and cross currency flows (clear rebound over 1.1000 in AUD/NZD). 


Very busy week ahead, with US President Trump's State of the Union address, January's FOMC meeting and the first NFP release of 2018.


In the commodities complex, WTI crude futures marginally extended above the USD 66.00/bbl level while Brent remains above USD 70bbl. Notable energy newsflow has included comments from the Iranian oil minister who stated that output declined in some oil fields due to lack of resources and added that Iran will seek lower production in coming years if it cannot be fixed. In metals markets, gold trades modestly lower as prices are hampered by the reprieve seen thus far for the USD. Elsewhere, focus has been on Zinc with prices surging to their highest levels in over 10 years amid speculation of contracting global supply. Iranian Oil Minister Zanganeh stated that output declined in some oil fields due to lack of resources and added that Iran will seek lower production in coming years if it cannot be fixed. JP Morgan raised their 2018 WTI forecast by USD 10.70/bbl to USD 65.63/bbl, and Brent forecast by USD 10/bbl to USD 70/bbl citing OPEC's efforts to rebalance the market.


Kicking the week off the big focus today should be in the US with the December PCE core and deflator data due, alongside the personal income and spending data. Also due to be released is the Dallas Fed manufacturing activity index for January while late in the evening we'll get the December jobless and retail sales data in Japan. Away from this, China's NPC Standing Committee is due to kick off a two-day meeting in Beijing in which it's expected that a revision to the constitution will be discussed. EU ministers will also meet in Brussels where they may decide on a new set of directives for Brexit negotiations. Elsewhere, the sixth round of NAFA talks are expected to conclude in Montreal and the ECB's Coeure and Lautenschlaeger will also speak.


US Event Calendar 
8:30am: Personal Income, est. 0.3%, prior 0.3% 
8:30am: Personal Spending, est. 0.4%, prior 0.6%; Real Personal Spending, est. 0.4%, prior 0.4% 
8:30am: PCE Deflator MoM, est. 0.1%, prior 0.2%; YoY, est. 1.7%, prior 1.8% 
8:30am: PCE Core MoM, est. 0.2%, prior 0.1%; PCE Core YoY, est. 1.5%, prior 1.5% 
10:30am: Dallas Fed Manf. Activity, est. 25.4, prior 29.7 


DB's Jim Reid concludes the overnight wrap


It's a potentially electrifying week ahead with a number of the big rolling themes at the moment having fresh data points for us all to pore over. It's fair to say that inflation is absolute key to macro at the moment and therefore the most watched print of the week will likely be average hourly earnings in Friday's payroll report. With regards to inflation and wages we also have the US PCE core and the deflator readings today, the US ECI index on Wednesday, the flash January CPI report for the Euro area also on Wednesday with country level reports out in Germany (Tuesday) and France (Wednesday) and US unit labour costs and productivity on Thursday.


In today's pdf we copy a chart from DB's Marcus Heider's inflation weekly from Friday night where he showed that periods of US$ weakness have typically been associated with higher inflation in developed markets over the past twenty years. He also discusses how Oil prices have benefited from news of another (counter-seasonal) weekly decline in US crude inventories and that recent news imply upside risks to oil price forecasts.


Regular readers will know we think that a number of variables are stacking up at the moment towards higher inflation and a combination of these two factors above potentially adds to the story.


Outside of inflation and labour costs, Friday's payroll report will be a focus (consensus 180k, DB at 210k) as will tomorrow's first State of the Union address by Mr Trump. It's not entirely clear yet what he will talk about but expect the recently passed Republican tax reform bill, trade, the state of the US economy and markets, infrastructure proposals and immigration to all potentially play a part. We also have the latest Fed meeting on Wednesday which Mrs Yellen will chair for the last time with Jerome Powell taking over next week. This meeting could be a bit of a non-event with the next rate hike pencilled in for the March meeting (market pricing currently around 95%). DB continue to expect four rate hikes in 2018 (one above that implied by the Fed dot plots). Away from this, Thursday will be a busy day for manufacturing sector data with the final global PMIs due along with the ISM manufacturing in the US. Finally, earnings season will really ramp up this week with 120 S&P 500 companies due to report, including the turn of some of the big tech heavy hitters including Facebook, Microsoft and eBay on Wednesday, and Alphabet, Amazon and Apple on Thursday. Pfizer, McDonald's (both Tuesday), AT&T, Boeing (both Wednesday), Shell, Alibaba (both Thursday), ExxonMobil and Chevron (both Friday) are amongst other notable companies scheduled to release results. The full week ahead is published at the end.


The week is off to a mixed start in Asia, with the Kospi 0.74% up, the Nikkei is broadly flat while the Hang Seng (-0.16%) and China's CSI 300 (-1.05%) are down as we type. The YEN jumped 0.76% back on Friday after Governor Kuroda noted that on inflation "…I think we're finally close to the target", but over the weekend, the BOJ clarified the Governor did not revise the inflation outlook and his view is in fact no different to the bank's Outlook for Economy Activities that was released earlier last week. This morning, the YEN is c0.2% weaker. Elsewhere, Bloomberg reported that hackers have stolen $500m of digital tokens from Japanese crytocurrency exchange Coincoin Inc. back on Friday.


In other news over the weekend, the ECB's Knot noted QE should end as soon as possible as "the program has done what could realistically be expected of it" and there is not a single reason to continue with it. Further, he added there there's enough proof for the ECB to end the program, which is also the current sentiment in the governing council.


Ahead of tomorrow's state of the union address, Friday's Davos speech by Mr Trump gave us some clues as to his current mood. Initially he noted the US would "no longer turn a blind eye" to what he described as unfair trade practices and will "enforce our trade laws and restore integrity to the trading system". That said, his other remarks seemed a bit less protectionist. He noted the US is "open for business" and that "now is the best time to bring your money....jobs…businesses to America". Further, he noted that he would always promote "America First", but he added "America first does not mean America alone. When the US grows so does the world". Elsewhere, he said "I may terminate NAFTA, I may not". So lots bubbling along until his big speech.


Now recapping other markets performance from Friday. US equities rose to fresh highs following strong corporate results, including Intel (shares +11%) and Abbvie (+14%). The S&P (+1.18%), Dow (+0.85%) and Nasdaq (+1.28%) were all higher as all sectors within the S&P advanced. European markets were all higher too, with key bourses up 0.3%-0.7% (DAX +0.31%; Stoxx 600 +0.50%; FTSE +0.65%). The VIX fell for the first time in four days to 11.08 (-4.3%).


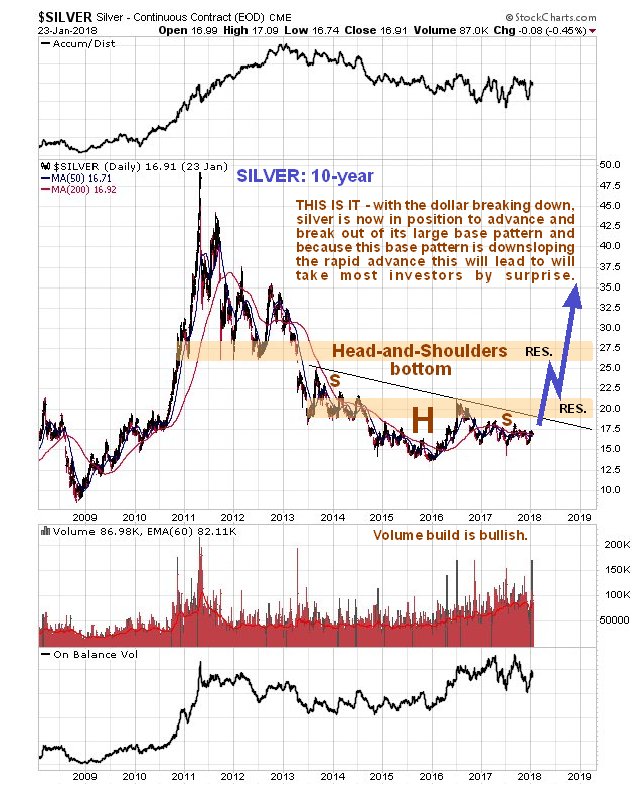
Over in government bonds, core 10y bond yields were 2-4bp higher with UST up 4.3bp to a fresh 3.5 year high (2.661%), while Bunds and Gilts rose 1.7bp and 3.2bp respectively. In currencies, the US dollar index extended its three year low (-0.36%), while the Euro and Sterling gained 0.25% and 0.13% respectively. WTI oil strengthened further, up 0.96% to $66.14/bbl (+4.5% for the week). Elsewhere, precious metals were slightly higher (Gold +0.06%; Silver +0.63%) and other base metals were mixed but little changed (Copper -0.60%; Aluminium -0.24%; Zinc +0.29%).


Away from the markets and onto some of the Brexit headlines. In Davos, President Trump said he would have taken a "different attitude" to Brexit talks and that "….I'd have taken a tougher stand in getting out". Back home, the UK opposition Labour Party leader Corbyn reiterated "we're not asking for a second referendum" on Brexit and that the UK should have a regulatory environment that is "commensurate with the EU, but must also have power to influence EU rules after Brexit. Elsewhere, a Guardian/ICM poll showed 47% of respondents would favour another referendum once the terms of UK's departure are clear. If excluding those without a view, 58% of respondents would support a second vote on Brexit. There is also lots of press (incl. Bloomberg) here in the U.K. suggesting that PM May is under increasing pressure within her party to exercise control with rival factions repeatedly speaking out with competing Brexit visions. A vote of no confidence and leadership battle is increasingly being discussed, as per Bloomberg.


Over in Germany, Ms Merkel seemed a bit more open to compromise in order to further progress in the coalition talks with the SPD. The CDU state premier KrampKarrenbauer noted that "our scope (to negotiate with the SPD) is very narrow", but Ms Merkel noted the preliminary agreement with the SPD is an "outline", which suggests some room for negotiations in order to finalise talks by 4th February.


We wrap up with other data releases from Friday. In the US, the 4Q GDP was below consensus at 2.6% annualised (vs. 3%).Our US economists noted that despite strength in consumer spending, growth in the quarter was impacted by an outsized increase in imports and materially less inventory accumulation than expected. Net exports subtracted -113bp from headline growth while inventories were an additional -67bp drag. They expect the latter will likely reverse, hence they have raised their Q1 real GDP growth forecast to 3.1% (from 2.3% previously).


The 4Q core PCE was in line at 1.9% qoq while personal consumption was slightly above market at 3.8% (vs. 3.7% expected). The December durable goods orders (ex-transportation) was in line at 0.6% mom but the prior month was upwardly revised by 0.4ppt, while core capital goods beat at 0.6% mom (vs. 0.4% expected). Finally, the December advance goods trade balance deficit widened to -$71.6bln (vs. -$68.9bln) and wholesale inventories grew 0.2% mom (vs. 0.4% expected). In the UK, 4Q GDP was above market at 0.5% qoq (vs. 0.4%) and 1.5% yoy (vs. 1.4%). Elsewhere, France's January consumer confidence was slightly below expectations 104 (vs. 106) but manufacturing confidence was above at 113 (vs. 112 expected), which is back to November levels that was a c11 year high.


What to look out for on Monday: Kicking the week off the big focus today should be in the US with the December PCE core and deflator data due, alongside the personal income and spending data. Also due to be released is the Dallas Fed manufacturing activity index for January while late in the evening we'll get the December jobless and retail sales data in Japan. Away from this, China's NPC Standing Committee is due to kick off a two-day meeting in Beijing in which it's expected that a revision to the constitution will be discussed. EU ministers will also meet in Brussels where they may decide on a new set of directives for Brexit negotiations. Elsewhere, the sixth round of NAFA talks are expected to conclude in Montreal and the ECB's Coeure and Lautenschlaeger will also speak.

CONTROLLED DEMOLITION OF THE MARKETS - DOLLAR, NEXT TREASURIES, THEN STOCKMARKET - GOLD, SILVER & PM STOCKS TO SOAR...

So, the sequence of events in this controlled demolition in a nutshell is this – the dollar drops hard, Treasuries, which are already very close to breaking down from their long-term uptrend, tank, and interest rates skyrocket. The stockmarket, already massively overstretched, implodes. The speculative urban Real Estate market crashes and gold and silver soar as a safehaven, amplified by acute shortage of physical, most of which now resides in vaults in China. Gold and silver miners, already streamlined and efficient, stand to make fortunes as gold and silver prices race far above their respective AISC (all in sustaining cost) breakeven levels, and gold and silver stocks skyrocket. When all this happens we can expect the resulting economic privation in the US to send the drug-addled population "loco", whereupon they will find themselves confronting a police force armed to the teeth with military equipment, and with the legal backing to "do whatever is necessary" afforded by the provisions of the Patriot Acts, and rioters will find that there is practically unlimited accommodation available for them in the extensive network of FEMA camps, where they will have plenty of time to read the detailed provisions of the Patriot Acts, if they can get their hands on a copy, unless of course, they are put to work, perhaps after being detoxed.
Let's now look at this sequence of impending market events on the charts. We start with the dollar, which has just broken down from a giant 3-year long Bullhorn Top or Broadening Formation. The dollar's immediate downside target following this clear breakdown is the 80 area on the index. A drop of this magnitude is huge and will have profound repercussions, not least on the Treasury market, because there will be little motivation to invest in a country whose currency is plunging. This looks set to occur regardless of any bounce to alleviate the short-term oversold condition

What we are about to witness in the markets will be similar to watching a gigantic controlled demolition, like say the World Trade Center controlled demolition in NYC. The initial charge that starts the whole sequence of momentous events is the dollar breakdown of recent days. This was triggered by the imposition of destructive trade tariffs by the Trump Administration who then made it plain they were happy to see the dollar drop to make US exports more competitive. Actions have consequences, and a falling dollar will make dollar denominated investments less attractive, like the Treasuries, which the US depends on to funnel the rest of the world's wealth into its coffers – the deal has always been this: the US prints up unlimited quantities of dollars and Treasuries, created electronically with a few keystrokes, and then exchanges them for goods and services from the rest of the world, with most of the inflationary consequences of this pushed off onto the rest of the world. Other countries around the world have until now gone along with this scam, because if they don't they get cut off from the SWIFT system, subjected to punitive sanctions or even invaded, or a combination of the three.


On the long-term 16-year chart for Treasury long bond proxy TLT we can see that its decades long bullmarket is showing clear signs of reversing, with upside momentum spluttering and a Head-and-Shoulders top completing. A breakdown from the large uptrend shown will usher in the first serious bearmarket in Treasuries for years that will send interest rates soaring, which will create an acute financial crisis in the debt-wracked US. With the dollar set to plummet this breakdown could happen soon.


On the 7-year 6-month chart we see that, within the giant uptrend shown on the 16-year chart, a bearish Rising Wedge has formed culminating in a Head-and-Shoulders top, which it is now very close to breaking down from…


Soaring interest rates will quickly rip the rug out from under the wildly overextended US stockmarket, which will crater in a manner that will make the '29 crash look like a walk in the park. On the 10-year chart for the S&P500 index we can see that the current meltup could run even further to the upper channel boundary of the channel shown on this long chart, before investors have a very nasty reality check, although it could reverse now at any time, especially given the dollar's slide and the storm clouds gathering over the Treasury market.


With Treasuries out of the question as a bolthole, safehaven money will gush into gold and silver, which will soar since there is already an acute shortage of physical, even before gold and silver have broken out of their large base patterns. This will bring a wry smile to the faces of Chinese bankers who have been squirreling away vast quantities of gold as fast as the stupid West would sell it to them. As for the US trying to tell China what it can or can't do in the South China Sea, it will be lucky to be able to finance a task force to sail over there, the way things are going, and if it does the Chinese have the military capability to send it to the bottom in less time than it takes to boil an egg, if they so choose.

Turning now to the charts for gold and silver, we see fine large base patterns completing in both. The extensive talk about manipulation suppressing prices of gold and silver is largely "sour grapes" by those who were too slow-witted to "get with the plot" and jump on the bandwagons that were rolling elsewhere, in Biotech, in Bitcoin, in the FANGs, in the broad market itself etc. These other bandwagons are now set to come to a abrupt halt by in some cases slamming into a wall like Bitcoin, as gold and silver take center stage again.
Gold is rapidly approaching completion of a fine large pleasingly symmetrical flat-topped Head-and-Shoulders bottom, with the massive volume buildup as the Right Shoulder of the pattern has formed, that has driven volume indicators strongly higher, giving the game away that it is shaping up for a major bullmarket. Breakout will be signaled by a break above the "neckline" resistance at the upper boundary of the pattern, a break clear above $1400 should do it. While there is another band of strong resistance to contend with in the $1530 - $1600 zone, it shouldn't have too much trouble breaking through that, given the conditions that we are rapidly heading towards.

The picture for silver is very similar, except that silver's Head-and-Shoulders bottom is downsloping, because silver tends to underperform gold at the tail end of bearmarkets. Because this downslope camouflages the incubating bullmarket much more than is the case with gold, it creates the conditions for explosive upside when the bullmarket does get going, especially as silver tends to be leveraged to the price of gold. It is actually hard for many investors to comprehend the upside potential of silver stocks after the long bearmarket.


When these bullmarkets at last get going in gold and silver, the gains in many gold and silver stocks are going to be breathtaking, here's why. Taking the case of gold producers, their performance is highly geared to the price of gold, because of their hefty and at times extremely burdensome fixed costs. All-in sustaining costs (AISC) are what it takes to keep the lights on and remain (just) economically viable, it's what it costs to produce an ounce of gold. In the case of many gold producers it is about $1000 - $1200 an ounce. If the price of gold is say $1200, which is a little below the mean cost in recent years, and a gold company's AISC is $1100, then it makes just $100 profit per ounce of gold. So what happens if the price of gold rises $1000, to $2200, which is a modest level given where we are headed? That's right – the company's profits go from $100 an ounce to $1100 an ounce, a MORE THAN 10-FOLD INCREASE IN PROFITS! – you don't have to be a genius to figure out what effect this is likely to have on the stock price. We already saw an example of this leverage during the 1st half of 2016. Towards the end of 2015 gold and silver mining companies were being squeezed until the pips squeeked by extremely low metals prices, with gold dropping as low at $1050 – many were bleeding red ink and on the verge of shutting up shop, but look what happened when gold and silver prices rose sharply early in 2016 and the pressure came off – gold stock indices soared, as you can see on the 10-year chart for the GDX below, which more than doubled in the space of a few months, and you can also see that like gold and silver themselves, GDX (and other gold stock indices) is marking out a large Head-and-Shoulders bottom, and is still some way from breaking out of it so stock prices are good.


If you want to see an example of the sort of rises we can look forward to when gold and silver break out of their base patterns, we need look no further than Coeur Mines, which rose from under $2 to over $16 in the space of a about 7 months, which is a more than 8-fold increase!! Coeur has since given half of this back, but looks poised to make a similar move when silver breaks out, although in percentage terms it probably won't be so big because it will be rising from a higher level.


Seen from outside Washington has descended to the level of a circus as those who really run the country continue to discredit and lame Trump, and at the same time attempt to smear Russia – Paul Craig Roberts in The Russiagate Stakes are Extreme believes that Russiagate is an organized plot to stage a coup against the elected President of the United States, which is hardly surprising since they have never accepted that their marionette Hillary Clinton lost the election – she couldn't accept it either and wrote an awful self-indulgent book about it entitled What Happened? which you would have to be retarded to waste your time reading. Despite him bending over backwards to ingratiate himself with them by talking about "our great military" and promising them even more of the national cake than the $700 billion dollars or so they receive already, and paying homage at the Wailing Wall in Jerusalem with a skull cap on, his efforts to placate them don't seem to have been enough.

Even if Russia did meddle in the elections, so what – what difference does it make?
The United States ceased to be a true democracy decades ago, and does not even have a government in the normal sense of the word. It is owned and run by a coterie of entrenched interest groups – the Military Industrial complex who mobilized to prevent a "peace dividend" after the end of the Cold War by creating enemies out of nowhere, Neocons with their plans for global domination and hundreds of military bases around the world, Zionists who see to it that Israel's interests always come first, Big Pharma who make sure the public keep taking their medications and lots of them, the GM food empire who snare farmers worldwide into servitude to them etc. All of these immensely powerful interest groups exercise absolute control over members of Congress and the Administration generally with bribes and coercion, and via the lobbying system and also control and direct the limited thought processes of the general public by means of the mainstream media which answers to them. With all these parasites draining the economic lifeblood of the country, it's easy to see why the American middle class has been dragged down in recent years, but it's hard to see a way out for the American people – revolution would seem to be out of the question for two big reasons, one is that most people are too soft after years of sitting around on comfy sofas watching TV, the other is that any attempt at revolution will be met with the enormous firepower of the now militarized police force, as the elites have moved to head off this possibility
Since the internet started, motivated and curious people have been able to find out the truth about what is really going on by searching around on it. This has been a continual source of annoyance to the elites who naturally want to control the internet, like they do the television and newspapers, so that they can mold public opinion to suit their purposes. They were not happy at all when Wikileaks founder Julian Assange unearthed a lot of their secrets and made them available for public scrutiny, so they tried to arrest him on ludicrous trumped up charges of indecent behavior with girls in Sweden, which is why he had to take refuge in an Embassy for years. However it now seems the elites have found the solution to the problem of the public finding out the truth on the internet. By coopting the key platforms like Facebook and Google, who we can reasonably presume they increasingly control, they can use AI (artificial intelligence) to scan and filter at lightning speed the vast quantities of information flowing through the internet, so that they can in effect implement an editorial policy that works to their advantage, with information or ideas that are contrary to their interests largely suppressed. This is set out in an article by Julian Assange entitled Assange Keeps Warning of AI Censorship and it's Time We Started Listening which certainly makes for interesting reading.
For those of us who really understand what's going on it's a tragi-comic sight to see millions of Americans shuffling like sheep into polling stations to vote on the one day every 4 years when the country is purportedly a democracy, thinking that their puny vote might make a difference, which it certainly won't, given that they are presented with the grand total of just 2 parties to choose from (apart from a token eccentric or two who garner perhaps 150 votes and are tolerated to give a veneer of democracy), with the politicians representing these 2 parties owned and vetted by all the interest groups listed above. It's going to be a sad day for those who have hijacked the United States when the dollar and Treasury market collapse and the source of their power dries up, which could happen a lot faster than many think possible.

Why The U.S. Stock Market Is Overbought And Overvalued

Summary

The monthly relative strength index (RSI) on the Dow Jones Industrial Average is at a record high and is at near record levels for the S&P 500.


High RSI values indicate extremely overbought conditions with an increased risk of a market decline.
The cyclically adjusted price-earnings (CAPE) ratio of the S&P 500 is well above historical means, indicating overvalued stock prices.
CAPE values corrected using alternate inflation data indicate downside risk is significant.
Investors may consider protecting themselves by increasing allocation to less overvalued sectors, such as energy and utilities, or investing outside the United States.
Currently, one of the most stunning indications of the overbought conditions in the stock market is the record levels of the monthly relative strength index (RSI). For the Dow Jones Industrial average, the monthly RSI is higher than it has ever been in the past 100 years:
A similar plot of the S&P 500 going back as far as 1925 also reveals near record levels for the monthly RSI:

(chart courtesy of stockcharts.com)
The record highest levels for the monthly RSI on the S&P index occurred in the years 1927-1929 just before the Great Depression began. We are not at those extreme levels for the RSI on the S&P 500 yet, but could be quite soon if stock prices continue to climb as they have recently.
The high RSI value indicates strong upward price momentum and overbought conditions. Similarly high RSI values were observed in the months leading up to all major market crashes, including the Black Tuesday crash of 1929, the Black Monday crash of 1987, the popping of the tech bubble in 2000, and the 2008 crash following the great financial crisis.

The Coming Market Crash Will Set Off The Biggest Gold Panic Buying In History

The leverage in the economic system has become so extreme; investors have no idea of the disaster that is going to take place during the next stock market crash.  The collapse of the U.S. Housing and Investment Banking Industry in 2008 and ensuing economic turmoil was a mere WARM-UP for STAGE 2 of the continued disintegration of the global financial and economic system.

While the U.S. and the global economy have seemingly continued business as usual since the Fed and Central Banks stepped in and propped up the collapsing markets in 2008, this was only a one-time GET OUT OF JAIL free card that can't be used again.  What the Fed and Central Banks did to keep the system from falling off the cliff in 2008 was quite similar to a scene in a science fiction movie where the commander of the spaceship uses the last bit of rocket-fuel propulsion in just the nick of time to get them back to earth on the correct orbit.

Thus, the only way forward, according to the Central banks, was to increase the amount of money printing, leverage, asset values, and debt.  While this policy can work for a while, it doesn't last forever.  And unfortunately, forever is now, here….or soon to be here.  So, it might be a good time to look around and see how good things are now because the future won't be pretty.

To give you an idea the amount of leverage in the markets, let's take a look at a chart posted in the article, A Market Valuation That Defies Comparison.  The article was written by Michael Lebowitz of RealInvestmentAdvice.com.  I like to give credit when credit is due, especially when someone puts out excellent analysis.  In the article, Lebowitz stated the following:

The graph above highlights that valuations using this measure dwarf any prior valuation peak since at least the 1950's. At over 350% above the mean, stock investors are currently paying significantly more for a unit of economic growth than at any time in the last 70 years. To extend the analysis, we estimated the adjusted CAPE level of 1929, as shown on the graph, and come to the same conclusion.

Most astute investors know that stock valuations are at or near historical highs. Even these investors, however, may be unaware that today's valuations, when adjusted for the level of economic growth and heightened profit margins, defy comparison with any prior period since the Great Depression. The simple fact is that investors are paying over three times the average and almost twice as much as the prior peak for a dollar of economic growth. Furthermore, it is happening at a time when we are clearly late in the economic cycle and the outlook for growth, even if one is optimistic, is well below that required to justify such a level.

The ratio in the chart comes from companies' profit margins and the GDP (Gross Domestic Product) adjusting CAPE (cyclical average price to earnings).  The important takeaway in the chart is that this ratio today (3.63) is much higher than in 1999 (1.91) or right before the 1929 Great Depression (2.68).  Thus, the author is suggesting that investors are paying over three times the average for a dollar of economic growth.  While this can continue a bit longer, the higher it goes, the bigger correction and return back to normal levels.

When the markets correct, I believe they will correct violently…. or most likely crash at some point.  Thus, the next market crash will cause the largest panic gold buying in history.

Setting Up The Foundation For Coming Gold Panic Buying Market

To understand the staggering amount of investor gold buying during the next market crash, we need to take a look at past trends in the gold market.  For example, there are three different volumes of global gold investment.  Actually, there is a fourth, Central Bank gold demand, but I am going to exclude it to focus only on private investment.

First, we have total global gold coin and bar demand.  As we can see in the chart below, global gold coin and bar demand increased significantly during the 2008 U.S. Housing and Investment Banking Collapse.  Gold coin and bar demand nearly doubled to 875 mt (mt) in 2008 from 442 mt in 2007:

As the gold price reached a peak of nearly $1,900 in 2011, gold coin and bar demand shot up to 1,498 mt.  However, as the price of gold fell by $500 in the first half of 2013, investors seeing an excellent bargain, purchased a record 1,716 mt of physical gold investment.  But as the gold price continued to fall and remain weak in 2014, 2015 and 2016, gold coin and bar demand stayed flat at a little more than 1,000 mt.

Furthermore, as the stock market took off after the election of President Trump to the Whitehouse and as Bitcoin and the Cryptocurrencies experienced nosebleed percentage gains, demand for physical gold investment fell even lower in 2017.

Even though physical gold investment demand over the past four years is less than during the 2010-2013 period, it is still more than double than what it was in 2007, before STAGE 1 of the Collapse… the infamous Subprime Housing Meltdown.

Global Gold ETF Demand… The Nasty Wild Card

While many investors in the alternative media community don't believe that the Gold ETF's hold all the gold they report, I look at this market as one of the most important indicators, or better yet, the critical Wild Card.  I really don't care if these Gold ETFs hold all the metal they claim.  If you are a prudent precious metals investor, you will hold most (if not all) of your gold physically.  However, the Gold ETFs provide us with the most important indicator in the gold market.

Why, because a large percentage of Gold ETF demand comes from retail investors.  Most precious metals diehard investors only believe in purchasing real physical metal.  So, when we see significant changes in the Gold ETF market, then it means the 99% of retail investors in the market are waking up.  The two largest increases in Gold ETF demand (and their inventories) were during two fearful market events… Q1 2009 and Q1 2016:

Of the total 624 mt of Gold ETF demand in 2009, 465 mt of that amount took place during the first quarter when the Dow Jones Index was falling to its gut-wrenching lows of 6,600.  Retail investors were in panic mode, so they were moving into Gold ETFs in a big way.  Thus, 75% of total Gold ETF demand in 2009 took place during the first three months of the year.

The next highest amount of Gold ETF demand was in 545 mt in 2016.  However, 350 mt or 64% of total Gold ETF demand that year also took place during the first quarter when the Dow Jones Index fell 2,000 points.  Something seriously spoked retail investors to plow back into gold during that period.  Moreover, as the Dow Jones was falling 2,000 points, the gold price was shooting higher by $200.  So, individuals who believe gold will selloff down to $750 with the next market crash, need to REREAD the sentence above.

Okay, getting back to the Gold ETF chart.  As the stock markets recovered in 2010, even as the price of gold surged to $1,900, Gold ETF demand continued to fall to a 306 mt in 2012.  However, as the gold price lost $500 in 2013, retail investors sold off their Gold ETF investments in record numbers.  As we can see, Gold ETF inventory liquidations were a stunning 912 mt in 2013.  As retail investors were selling their Gold ETF investments, precious metals investors around the world were buying physical gold, HAND OVER FIST.  It was in 2013 that global gold coin and bar demand surged to 1,716 mt.

After the initial gold price smash in 2013, Gold ETF liquidations were reduced to only 184 mt in 2014 and 125 mt in 2015.  Again, it wasn't until the stock market suffered what investors thought as a worrisome correction, did Gold ETF demand returned in a big way in 2016.  And as the stock and crypto markets shot up towards the moon and stars, Gold ETF demand declined considerably in 2017.

Again, I am not going to debate whether or not the Gold ETFs hold all the gold they claim.  If you are smart, you own physical gold and if you want to trade profits, then using Gold ETFs for that purpose is understandable… but not to PROTECT WEALTH, only to trade for profits.

Total Gold Investment Demand Fluctuates Due To Fickle Retail Investors

If we combine gold coin and bar demand with Gold ETF demand, we have another chart.  This chart represents the NET global gold investment.  As we can see, total global gold demand was the highest in 2011 when the gold price shot up to $1,900 in September of the year:

After the 2008 U.S. Housing and Investment Banking collapse, and as the gold price recovered, total global gold investment increased from 695 mt in 2007 to a peak of 1,730 mt in 2011.  It wasn't until 2013 when the gold price lost $500 did the massive global Gold ETF liquidations impact overall demand by cutting it in half to 803 mt versus 1,610 in 2012.  And as I mentioned above, total global gold investment didn't rise until FEAR in the markets reappeared at the beginning of 2016 when retail investors flocked back to Gold ETFs.

While global gold investment is forecasted to decline in 2017 to 1,155 mt, due to investors placing their bets in the rapidly rising stock and crypto markets, I believe this is the CALM before the STORM.  Unfortunately, retail investors have been lured to sleep by rising asset values that they don't realize the market is setting up for one hell of a correction-crash.

What Record Gold Investment Will Look Like When The Markets Finally Crash

By looking at previous record years of gold coin and bar investment as well as Gold ETF demand, we can estimate how much total gold investment will increase during the next market crash.  For example, there was 624 mt of Gold ETF demand in 2009 and 1,716 mt of gold coin and bar investment in 2013:

If we add these two previous record years together, we end up with a total of 2,340 mt of total gold investment.  Now, this figure represents what has already taken place in the gold market during both peak periods of gold investment demand.  However, if we estimate the kind of demand that would take place during the next market crash, it can undoubtedly reach 3,000 mt or even 4,000 mt during a full-blown market meltdown.

Investors need to realize that the decade-long Fed and Central Bank band-aid of massive money printing and exponentially rising debt levels since the 2008 market crash has not fixed the problem, it has only made it worse.  They have inflated asset values of stocks, bonds, and real estate to such high levels; a normal market correction will turn into a panic crash.  The next market crash will be like nothing we have witnessed before.  Thus, panicked investors will move into the safe-haven gold market in record numbers.

I believe we could easily see 1,000+ mt of global Gold ETF demand and 2,000+ mt of gold coin and bar investment during the next market meltdown.  However, total global gold investment demand could approach 4,000 mt and exceed it if the Fed and Central Banks lose control of the markets.  And, it's not a matter of "IF," it is a matter of "WHEN."

According to the World Gold Council, total gold demand in 2016 was 4,350 mt, with total gold investment demand of only 1,587 mt.  Thus, gold investment accounted for only a little more than a third of overall gold demand last year.  When global gold investment demand surges to 3,000 or even 4,000 mt, where is the supply going to come from when investors around the world realize the GIG is up?

Lastly, the critical WILDCARD in the gold market is the retail investor.  The retail investor accounts for 98-99% of the market.  So, when the retail investor gets spooked as FEAR starts to motivate their investing decisions, we could see insane Gold ETF demand. Unfortunately, there may not be enough physical gold to go around.  Thus, Gold ETFs may not be able to access the metal to increase their inventories in relationship to rising demand.

So, it makes perfect sense that the real FIREWORKS in the gold market will take place where 99% of the market makes the decisions.  While the 1-2% of precious metals investors would most certainly increase the gold and silver holdings during the next market crash, it's the retail investors that will totally overwhelm the gold market.

Keep an eye on Gold ETF demand as it will be the crazy WILDCARD.