domenica 28 gennaio 2018

The big picture


THE BIG PICTURE


We like to study the relationship between long term interest rates and money supply growth (monetary inflation). In the bottom section of the chart a 3 year moving average of M3 growth in Australia is represented by the red line. 10 year bond yields are depicted in green. When the 3 year moving average of M3 growth rises above 10%, and interest rates fail to keep up, this represents periods in time where gold tends to outperform other asset classes. Money moves into gold for the protection it offers against the harmful effects of monetary inflation. In other words interest rate levels are not offering a satisfactory level of protection. We can see evidence of this occurring in the 1970's. This was the last time in history gold clearly outperformed the All Ordinaries index as demonstrated in the top section of the chart. We are arguably seeing a more pronounced example of this occurring today. Interest rates and money supply growth are effectively heading in opposite directions. Gold continues to be the primary beneficiary of this irresponsible monetary policy which is being implemented by our central banks globally. As it has done so repeatedly throughout history gold offers investors a place to preserve The purchasing power of their wealth.

Bonds Finally Noticed What Is Going On... Stocks Are Next


It is safe to say that one of the most popular, and important, charts of 2017, was the one showing the ongoing and projected decline across central bank assets, which from a record expansion of over $2 trillion in early 2017 is expected to turn negative by mid 2019. This is shown on both a 3- and 12-month rolling basis courtesy of these recent charts from Citi.


The reason the above charts are key, is because as Citi's Matt King, DB's Jim Reid, BofA's Barnaby Martin and countless other Wall Street commentators have pointed out, historically asset performance has correlated strongly with the change in central bank balance sheets, especially on the way up.


As a result, the big question in 2017 (and 2018) is whether risk assets would exhibit the same correlation on the way down as well, i.e. drop.


We can now say that for credit the answer appears to be yes, because as the following chart shows, the ongoing decline in CB assets is starting to have an adverse impact on investment grade spreads which have been pushing wider in recent days, in large part due to the sharp moves in government bonds underline the credit spread.


And, what is more important, is that investors appear to have noticed the repricing across credit. This is visible in two places: on one hand while inflows into broader credit have remained generally strong, there has been a surprisingly sharp and persistent outflow from US high yield funds in recent weeks. These outflows from junk bond funds have occurred against a backdrop of rising UST yields, which recently hit 2.67%, the highest since 2014, another key risk factor to credit investors.


But while similar acute outflows have yet to be observed across the rest of the credit space, and especially among investment grade bonds, JPM points out that the continued outflows from HY and some early signs of waning interest in HG bonds in the ETF space in the US has also been accompanied by sharp increases in short interest ratios in LQD (Figure 13), the largest US investment grade bond ETF...


... as well as HYG, the largest US high yield ETF by total assets,


This, together with the chart showing the correlation of spreads to CB assets, suggests that positioning among institutional investors has turned markedly more bearish recently.


Putting the above together, it is becoming increasingly apparent that a big credit-quake is imminent, and Wall Street is already positioning to take advantage of it when it hits.


So what about stocks?


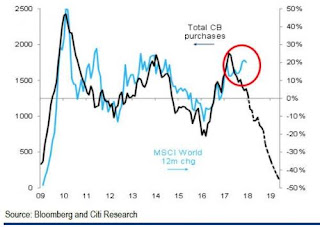
Well, as Citi noted two weeks ago, one of the reasons why there has been a dramatic surge in stocks in the new years is that while the impulse - i.e., rate of change - of central bank assets has been sharply declining on its way to going negative in ~18 months, the recent boost of purchases from EM FX reserve managers, i.e. mostly China, has been a huge tailwind to stocks.


This "intervention", as well as the recent retail capitulation which has seen retail investors unleashed across stock markets, buying at a pace not seen since just before both the 1987 and 2008 crash, helps explain why stocks have - for now - de-correlated from central bank balance sheets. This is shown in the final chart below, also from Citi.


And while the blue line and the black line above have decoupled, it is only a matter of time before stocks notice the same things that are spooking bonds, and credit in general, and get reacquainted with gravity.


What happens next? Well, if the Citi correlation extrapolation is accurate, and historically it has been, it would imply that by mid-2019, equities are facing a nearly 50% drop to keep up with central bank asset shrinkage. Which is why it is safe to say that this is one time when the bulls will be praying that correlation is as far from causation as statistically possible.


Fabrizio

Kunstler On What Happens Next: Blow-Off Orgies & Financial Smash-Ups


The blow-off orgy in the stock markets is supposedly America's consolation prize for what many regard as the electoral bad acid trip of the Trump presidency.


Sorry to tell you, it's just another hallucination, something you're going to have to come down from. Happy landings!


While the markets have roared parabolically up, in Technicolor, with sugar-on-top; that ole rascal, Reality, is working some hoodoo in the other rings of this psychedelic circus: namely the dollar and the bond market. The idiots on NPR's Marketplace and the Cable TV financial shows haven't noticed the dollar tanking the past several months or the interest rates creeping up in the bond markets. Well, isn't that the point of living as if anything goes and nothing matters, the mantra of the age?

Alas , things are connected and consequences await. It would be rich if a flash crash ripped the Dow, S & P, and the Nasdaq to shreds twenty minutes after the Golden Golem of Greatness finished schooling the weenies of Davos on the bigly wonderfulness of his year in office. In fact, it would be a crowning comic moment in human history. I can imagine Trump surrounded by the fawning Beta Boys of Banking as the news comes in. Poof! Suddenly, he is alone in the antechamber backstage, nothing left of his admirers but the lingering scent of aftershave. The world has changed. The dream is over. In the mirror he sees something that looks dimly like Herbert Hoover in a polka-dot clown suit, with funny orange wig….

A financial smash-up is really the only thing that will break the awful spell this country is in: the belief that everyday life can go on when nothing really adds up. It seems to me that the moment is close at hand. Treasury Secretary Mnuchin told the Davos crowd that the US has "a weak dollar" policy. Is that so? Just as his department is getting ready to borrow another $1.2 trillion to cover government operations in the year to come. I'm sure the world wants nothing more than to buy bucket-loads of sovereign bonds backed by a falling currency — at the same time that the Treasury's partner-in-crime, the Federal Reserve, is getting ready to dump an additional $600 billion bonds on the market out of its over-stuffed balance sheet. I'd sooner try to sell snow-cones in a polar bomb-cyclone.

When folks don't want to buy bonds, the interest rates naturally have to go higher. The problem with that is your country's treasury has to pay the bond-holders more money, but the only thing that has allowed the Treasury to keep borrowing lo these recent decades is the long-term drop of interest rates to the near-zero range. And the Fed's timid 25-basis-point hikes in the overnight Fed Fund rate have not moved the needle quite far enough so far. But with benchmark ten-year bond rate nosing upward like a mole under the garden toward the 3.00 percent mark, something is going to give.

How long do you think the equity indexes will levitate once the bond market implodes? What vaporizes with it is a lot of the collateral backing up the unprecedented margin (extra borrowed money) that this rickety tower of financial Babel is tottering on. A black hole is opening up in some sub-basement of a tower on Wall Street, and it will suck the remaining value from this asset-stripped nation into the vacuum of history like so much silage.


Thus will begin the harsh era of America screwing its head back on and commencing the salvage operation. We'll stop ricocheting from hashtag to hashtag and entertain a few coherent thoughts, such as, "…Gee, it turns out you really can't get something for nothing…." That's an important thought to have when you turn around and suddenly discover you've got nothing left.