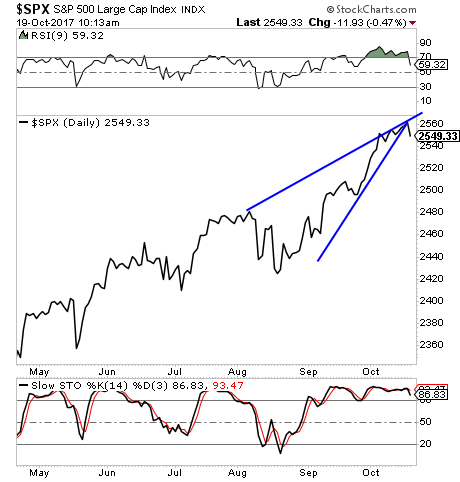
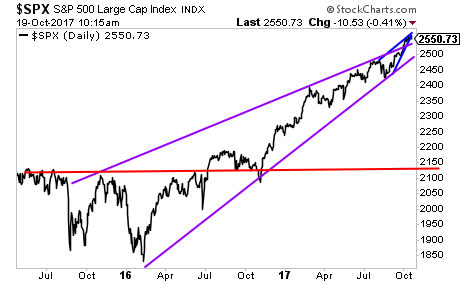
The late stages of financial bubbles are always tough for rational analysts. Focused as they are on the numbers, such analysts are relatively immune to the emotion that drives the action at market extremes, so they find themselves making predictions that turn out to be "wrong" for months and sometimes years.
Then the cycle turns and the rational analyst is vindicated – though often far too late for his bruised ego and diminished client base to easily recover.
[Recall the scene in The Big Short where hedge fund manager Michael Burry, after suffering months of abuse from his clients for shorting the 2006 housing bubble a bit early, is lambasted by a client who can't believe Burry has, after the crash, gone long equities — because they're clearly going to zero. In both cases Burry was right and his clients wrong, but he nevertheless closed up shop and quit the business.]
Anyhow, we're there again, with governments manipulating all major markets to valuation levels at which previous crashes have occurred. This is leading analysts who focus on historical norms to issue warnings, which turn out to be wrong (stocks are setting new records as this is written), which draw derision from people who see no reason why the party ever has to end.
A good example is J.H., whose eponymous family of funds has been on the wrong side of this market for an uncomfortably long time. Yet he persists, because the numbers don't lie. From his most recent report to clients:
So the mindset, I think, goes something like this. Yes, market valuations are elevated, but, you know, low interest rates justify higher valuations. Besides, there's really no alternative to stocks because you'll get what, 1% annually in cash? Look at how the market has done in recent years. There's no comparison. Value investors who thought stocks were overpriced in recent years have been wrong, wrong, and wrong again, and even if they're eventually right, being early is just the same as being wrong. The best bet is just to invest in a passive index fund for the long-term, and ignore the swings. There's really no alternative.
What's notable about this mindset is its excruciating reliance on three ideas. The first is that low interest rates "justify" rich valuations. The second is that market returns simply emerge as a kind of providence from a higher power, perhaps magical gnomes, or the Federal Reserve if you like, and that those returns have no particular relationship to valuations even in the long-term. The third is that market returns during the recent advancing half-cycle are an accurate guide to future outcomes.
In effect, stocks are viewed as good investments because they have been going up, and the evidence that stock prices will go up is that stock prices have gone up. Every additional market advance makes stocks look even better, based on past returns. Indeed, the more extreme valuations become, the more convinced investors become that extreme valuations don't matter.
And that's why we're all gonna die.
A few insights may help to deconstruct this mindset. First, if one is going to invest one's financial future in the stock market here, it's worth making at least a cursory study of 5, 10 or even 20-year growth rates in population, labor force, productivity, S&P 500 revenues, earnings, real GDP, nominal GDP, and virtually every other measure of fundamentals. That exercise will quickly inform investors not only that the growth rate of fundamentals has persistently slowed from post-war norms in recent decades, but also that the underlying drivers of growth (primarily labor force demographics and productivity growth) are now running at rates that are likely to produce real GDP growth on the order of just 1% annually over the coming decade, while even a sizeable jump in productivity would likely result in sustained real GDP growth below 2% annually.
Unfortunately, this has implications for how one responds to interest rates, because the argument that "low interest rates justify higher valuations" relies on the assumption that the growth rate of underlying cash flows is held constant. Any basic discounted cash flow analysis will demonstrate that if interest rates are low because growth is also low, then no market valuation premium is "justified" by the low interest rates at all. Indeed, if both growth rates and interest rates are x% lower than their historical norms, then even a historically normal level of market valuation would be associated with subsequent market returns that are x% below historical norms. No valuation premium is required to produce this result.
The most reliable valuation measures we identify (those most strongly correlated with actual subsequent market returns) are about 2.5 to 2.7 times their historical norms here. Paying a valuation premium in this case simply causes prospective future market returns to collapse.
In order to provide the longest perspective possible, and also to offer a measure that can be easily calculated and validated should one choose to do so, the chart below shows my variant of Robert Shiller's cyclically-adjusted P/E (CAPE), which has a correlation near 90% or higher with actual subsequent 10-12 year S&P 500 total returns in market cycles across history.
What investors presently take as a comfortable environment of pleasant market returns and mild volatility is actually, quietly, the single most overvalued point in the history of the U.S. stock market.
H.'s conclusion is, obviously, that a horrendous crash is coming. The problem is that this – and most other valuation measures – started flashing red in 2013, so warnings based on them now have a hollow ring.
Will they end up being be right? Without a doubt. And the longer the current exuberance goes on the bigger will be the subsequent crash. Somewhere out there is the perfect moment to short the hell out of this and pretty much every other country's stock market. But only a tiny handful will nail it.


